Archive for June 2014
Weekly technical analysis for 7 – 11.04
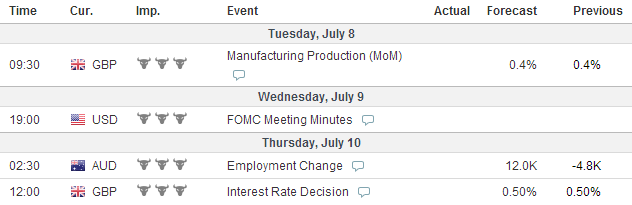
IMPORTANT ECONOMIC EVENTS DURING THE WEEK (GMT)
EURUSD:

After interacting with Simple Moving Average 150, the price was resisted and bounced through the green bullish trend line from June 12. The price decreased to the 61.8% Fibonacci Level afterwards, where it looks it is getting supported now. Furthermore, the consolidation around the 61.8% Fibonacci Level resembles a falling wedge formation (orange), which, as we all know, has bullish potential. For this reason, we believe that a bounce from the 61.8% Fibonacci level is about to appear. On the other hand, we get a contrary signal from the momentum indicator, which has just crossed the 100-level line in bearish direction, but at the same time, the cross is tiny and as we see, the indicator is changing direction and might cross the 100-level line back.
USDJPY:

After decreasing to the 101.307 support, the Yen did a bullish bounce and started moving in bullish direction, which was pretty much what the price was doing during the last week. Currently the price is consolidating, where the consolidation resembles a triangle. At the same time, the momentum indicator has crossed the 100-level line in bullish direction, which implies, that the price would eventually break the triangle in bullish direction. For this reason, we believe that the price is likely to increase to the 102.729 resistance, like it has been doing the last two times.
GBPUSD:

After breaking through its 5-years high, the price has increased with about 120 pips more and it started creating bearish candles, which speaks of an eventual change in the direction of the pair, or for an eventual correction. Furthermore, there is an obvious divergence between the tops and the bottoms of the chart and the momentum indicator, which supports our bearish thesis. For this reason, we believe that the price would eventually decrease to the lower level of the pink bullish corridor or even to the 1.70527 support or the lower level of the blue bullish corridor from the last year.
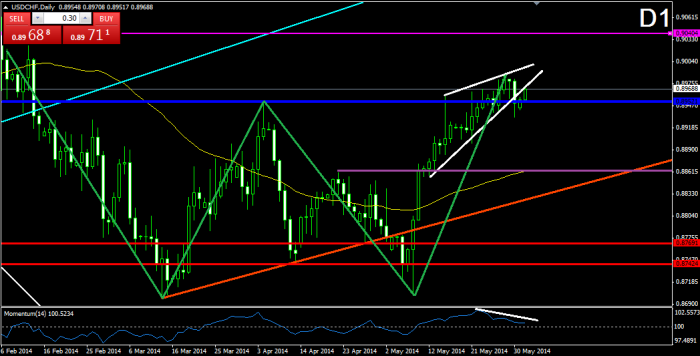
USDCHF:

After breaking in bearish direction through the green bullish corridor, the price decreased to 0.88550n where it found support and bounced in bullish direction. The price increased and it is currently meeting the already broken neck line of the big double bottom formation (W1) at 0.89520 as a resistance. The last three candles of the increase of the price resemble a rising wedge formation, which as we all know, has bearish potential. For this reason, we believe that the price would eventually drop. At the same time, the momentum indicator has done a tiny cross of the 100-level line, but its behavior during the last candle of the price shows that it might return back beyond the 100-level.
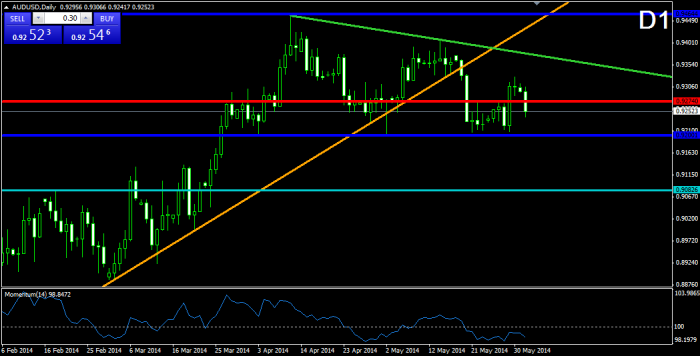
AUDUSD:

After breaking in bearish direction through the purple bullish trend line from May 29, the price decreased to the already broken green bearish line from April 10 and tested it as a support. The Aussie bounced in bullish direction, which speaks of an upcoming new bullish activity. On the other hand, the momentum indicator has crossed the 100-level line in bearish direction, which means that the bounce from the already broken green bearish trend line might appear to be only a correction of a further bearish movement. For this reason, it might be good here to wait for the momentum indicator to go above the 100-level line, or for the price to go beyond the green bearish line, so we would have a confirmation on one of the scenarios.
Weekly technical analysis for 23 – 27.06
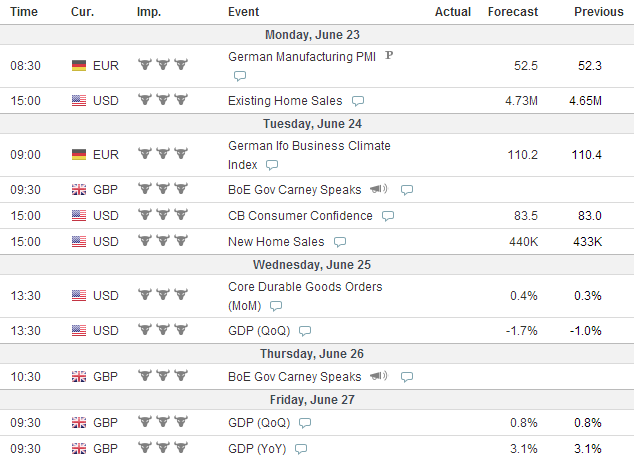
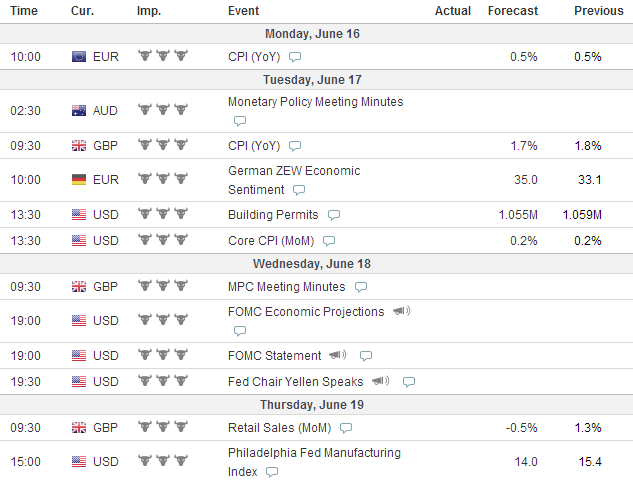
IMPORTANT ECONOMIC DATA DURING THE WEEK (GMT)
EURUSD:
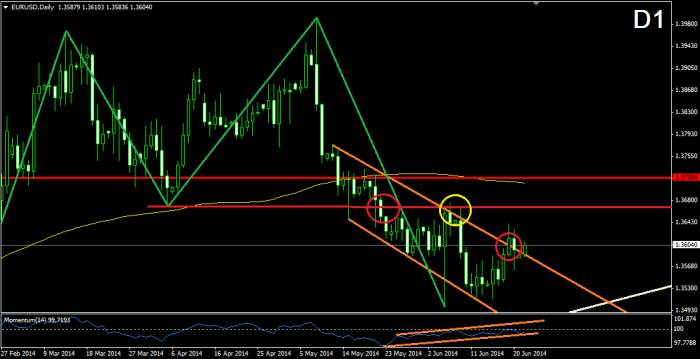
The price did a bullish break through the upper level of the orange bearish corridor from May 12. As you probably remember, the price was moving after a double top formation (green) and was expected to reach the white bullish line, which connects the bottoms from July 2012 and July 2013 on the MN chart. The bullish break through the bearish corridor implies that the price might reach as a resistance the already broken neck line of the green double top formation. Furthermore, there is a bullish divergence between the bearish corridor and the momentum indicator, which shows a bullish corridor. For this reason, we believe that this might be the end of the bearish movement and the price might reach new levels like 1.37184.
USDJPY:
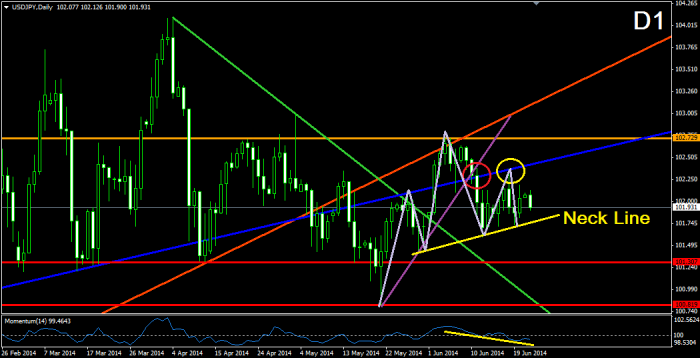
The bearish break of the price through the small purple bullish trend line has moved the price in such way, so a head and shoulders formation (gray) is about to get confirmed. At the same time, there is a clear bearish divergence between the last two bottoms of the chard and the momentum indicator, which also speaks of an upcoming bearish activity. Furthermore, after the break through the purple bullish trend line, the price returned and bounced from the already broken blue bullish trend line as from a support. For this reason, we believe that the price might start a new bearish movement, which could eventually break through the support at 101.307 and has the potential to reach the next crucial support at 100.819
GBPUSD:
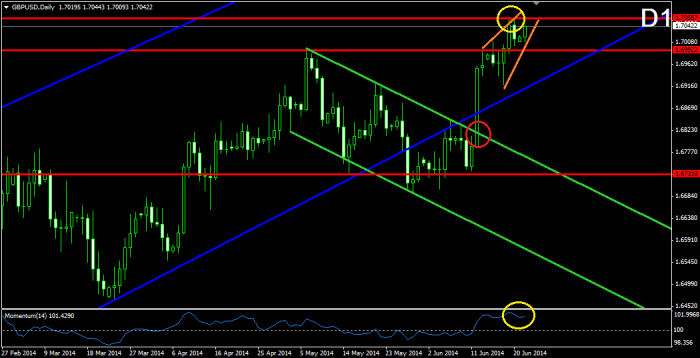
After the bullish break through the green bullish corridor, the price also broke through the resistance at 1.69922, which indicates the previous top of the price from the same rank, and then it stopped in the 1.70587 level, which indicates the 5-years high of the price. As you see, the latest bullish movement of the price (orange) resembles a bit a rising wedge formation, which as we all know, has the potential to send the price downwards. At the same time, the momentum indicator is located pretty high, which implies that a drop might be about to occur. Maybe the price would not manage to break the 5-years high at 1.70587 after all.
USDCHF:
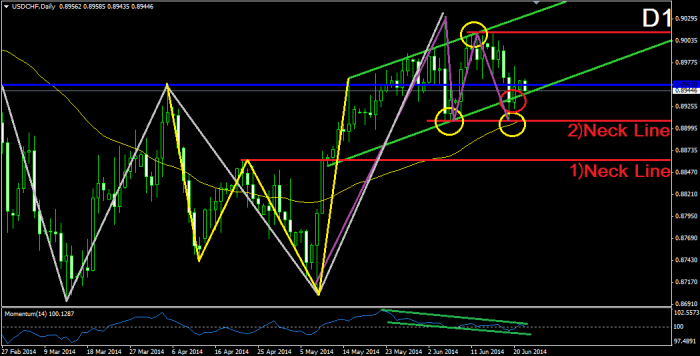
The first things we notice on the D1 chart of the Swissy are: the potential double top formation (purple) and the bearish divergence between the chart of the price and the momentum indicator in the past 30 days. As we all know, these two conditions have bearish potential and could send the price downwards. Another bearish sign is the break of the price through the lower level of the green bullish corridor, which supports the bearish scenario. These conditions could drop the price at least to the support, which indicates the neck line of the small and already completed double bottom formation (yellow). At the same time, this would confirm the purple double top formation and could push the price even further. On the other hand, the price might continue its bullish increase and could reach at least the resistance, which indicates the second top of the purple double top formation and even the upper level of the green bullish corridor.
AUDUSD:
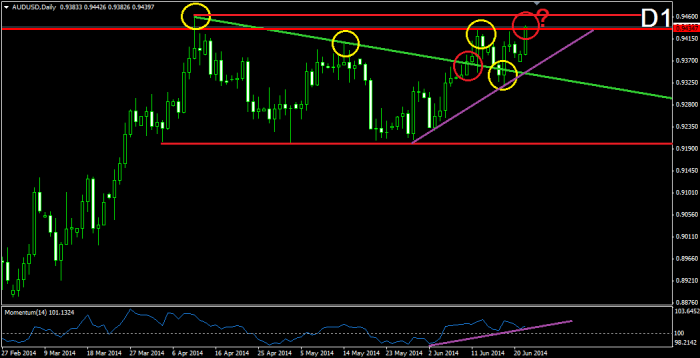
After the ice price broke through the green bearish trend from April 10, we saw the price returning to the level and testing it as a support. The followed bullish bounce brought the price to the resistance at 0.94347, which indicates the high point of the price after the break through the green bearish trend line. The break through the 0.943476 resistance gives us now a clear signal for a change in the bearish trend (green). The overall bullish movement follows a bullish trend line (purple), which set its beginning on May 29. So, after the break, the price might find resistance in the next red level, which indicates the 5-months high of the price from April ten, and to return to the purple bullish trend line.
Weekly technical analysis for 16 – 20.06
IMPORTANT ECONOMIC EVENTS DURING THE WEEK (GMT)
EURUSD:

On the D1 chart we notice that after crossing the 1.36710 blue neck line of the big green double top formation, the price started moving in a bearish corridor (orange). After bouncing from the upper level of the corridor, the price had just bounced from the lower level of the corridor, which implies that the pair might eventually return to the upper level of the corridor again, before making any other bearish movements. At the same time, there is a bullish divergence between the last bottoms of the chart and the momentum indicator, which supports an eventual bullish correction.
USDJPY:

After testing again the resistance at 102.723, the price did a bearish bounce, which sent it through the three times tested blue bullish trend line from May 21. The price even crossed in bearish direction the already broken dark blue bullish trend line from the beginning of February. At the same time, the momentum indicator broke in bearish direction from its yellow bullish trend line and then it tested it as a resistance, which supports the potential bearish movement we are discussing. For this reason, we believe that the price would eventually drop during the week and would probably meet the supports at 101.201 and 100.792.
GBPUSD:

After breaking through the upper level of the green bearish corridor from May 6 and at the same time, through the resistance at 1.68116, the price also broke through the already broken lower level of the blue bullish corridor from November 2013 and increased to the 5-years high of the price from one month ago. Afterwards, the price broke through the 1.69974 resistance, which indicate the 5-years high and now, it is about to test the top from 5 years ago. If the price breaks it, this would create a 6-years high. The resistance, which indicates the top from 5-years ago is located at 1.70547, which is not visible on the D1 chart, but on the W1. Having in mind that the price did such a significant bullish break, we could expect an increase at least to the top from 5-years ago at 1.70547. For this reason, we might see a bearish correction first. If the price increases even more, the already broken 1.69946 resistance might be turned into a support and the price might use this level in order to trigger itself in bullish direction. Another good support might appear to be the lower level of the already broken blue bullish corridor. The price might return there for a test and a bullish bounce.
USDCHF:

The price increased again to the upper level of the already broken rising wedge formation, and it bounced in bearish direction afterwards. Now the price is out of the wedge again. If the price drops, it would eventually meet the 0.89521 level, where it could be supported. After all, we should not forget that there is a big double bottom formation, which the price confirmed a month ago (purple). For this reason, it is likely to see the price following the double bottom formation, where the price has completed about 30% of the potential bullish movement yet. Currently, the momentum indicator is above, but almost on the 100-level line and it could be used as a trigger for a short position until the support at 0.89521. At the same time, there is a bearish divergence between the indicator and the chart of the price, which supports the bearish drop.
AUDUSD:

After the price broke through the green bearish line from April 10, which connects the last tops of the price, the Aussie is currently moving in a bullish direction toward the resistance at 0.94644, which indicates the 6-months high of the price. We would like to note, that the upward movement happens in a rising wedge formation, which, as we all know, has the potential to break in bearish direction. Currently, the price is testing the lower level of the wedge, which implies that a bullish bounce is likely to occur. This bounce could actually send the price to test the 0.94644 level. At the same time, the wedge would be to its end and the blue resistance in a combination with the bearish potential of the purple wedge, could send the price downwards.
EURUSD:

After the break through the 1.36710 neck line, the double top formation (red) on the D1 chart brought the price to form a falling wedge formation, which broke through the upper level during the last week. The price was send to test the already broken 1.36710 neck line as a resistance, and currently we notice a bounce from this level, which implies for an eventual bearish activity. On the other hand, the momentum indicator has just crossed the 100-level line in bullish direction which is in a contradiction with the bearish bounce from the neck line. Having in mind that the price has not still fully completed the red double top formation, we might see another strong decrease of the price.
USDJPY:

After the bullish break through the three times tested green bearish trend line from April 4, the price increased and tested the already broken orange bullish trend line from March 2013 as a resistance and the 102.723 resistance at once. As you can see, after interacting with these levels, the price definitely demonstrates a slowdown and a potential for a decrease. For this reason, we should carefully watch the behavior of the price on these two levels. A bullish break might bring the price to interact with the old 103.822 resistance (red). A bearish bounce from the two levels would turn into a potential support any previous bottom of the price.
GBPUSD:

After confirming the double top formation on D1 (green) with crossing the 1.67327 neck line, the price increased to the yellow bearish line again. As we know, the yellow bearish line connects the two tops of the double top formation. With testing it for third time, the price has turned the line into a bearish trend. Currently, the price is still on the yellow bearish trend and also, the price is testing the already broken lower level of the blue bullish corridor as a resistance. At the same time, the momentum indicator is testing the 100-level line from the same side. For this reason, we believe that the current situation is crucial for the Cable. A bullish break in the yellow bearish trend line might actually lead to new highs and a cross in the 100-level line for the momentum indicator could be used as a signal for this scenario. On the other hand, as we know, the price has a double top formation to complete, so a bearish bounce from the green bearish trend is very likely to occur.
USDCHF:

The price broke the lower level of the green rising wedge formation and decreased with about 50 pips, which almost accomplished the potential of the formation. At the same time, the momentum indicator crossed the 100-level line in bearish direction, which confirmed the bearish movement. This means that the potential bearish correction could last even longer, and the price might decrease even more – for example to the Simple Moving Average 50 or the orange bullish line. The situation by the Swissy is pretty similar to the EUR/USD pair. Here we have a confirmed double bottom formation (yellow), which has a strong bullish potential. For this reason, we believe that after reaching a certain support level, the price would probably return to its bullish habits.
AUDUSD:

The potential double top formation by the Aussie is currently turning into a bullish pennant. Currently, the price is testing the green bearish line for third time, which turns the green line into a bearish trend line. At the same time, the momentum indicator records a slowdown in its last movement, which is relevant with the interaction of the price with the green bearish trend. Anyway, we should follow the behavior of the price on the green bearish trend, because a bullish break might destroy the bearish expectations and the price might increase to the 0.94644 resistance, which is above the previous top of the price. On the other hand, if the price is going to move according to the flag, we should expect another decrease to the 0.92001 support (the lower level of the flag) before any bullish break. Furthermore, such decrease might even bring the price through the 0.92001 support, which is also the neck line of the double top formation (yellow) which seems lost for now.
Weekly technical analysis for 2 – 6.06
IMPORTANT ECONOMIC EVENTS DURING THE WEEK (GMT)
EURUSD:
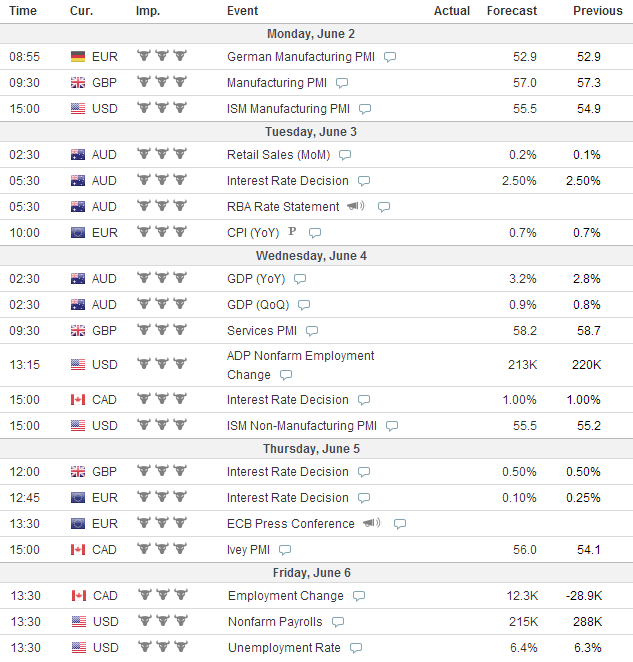
After breaking through the lower level of the purple triangle on D1, the price confirmed a double top formation (D1) and the followed bearish movement formed a falling wedge formation, where the price is currently testing the upper level of the formation. At the same time, the momentum indicator is about to cross the 100-level line in bullish direction. For this reason, we believe that the price might do a correction to the already broken neck line of the double top formation (blue) and even to the turquoise bearish trend line from 2008.
USDJPY:
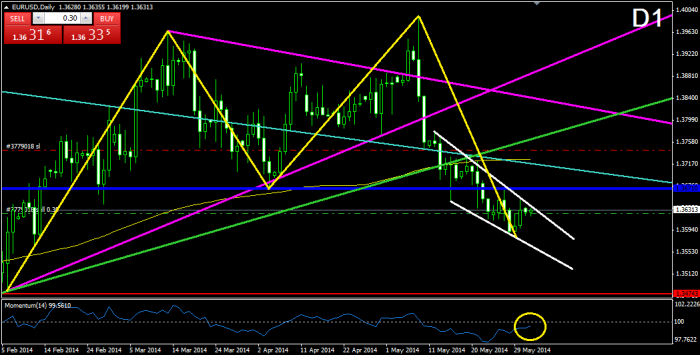
After the last bullish bounce from the already broken purple bearish trend line from December 2013, the price increased to the green bearish trend line from April 04. The green bearish trend got broken in bullish direction. At the same time, the momentum indicator has crossed the 100-level line in bullish direction, which supports the eventual bullish break and the eventual bullish movement. If this happens, the price is expected to reach at least the orange 102.723 resistance.
GBPUSD:
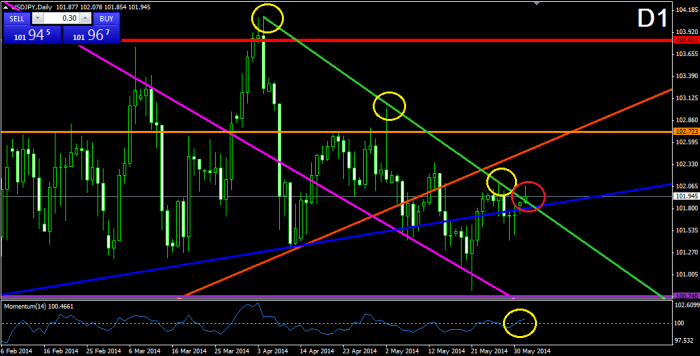
The price formed a 3-times tested bearish trend line (green), which was formed on May 6, where after the last bounce, the price confirmed a double top formation with crossing the neck line at 1.67327. At the same time, the momentum indicator confirms the current bearish movement with a trend line, and with the interruption of the 100-level line in bearish direction. Currently, after crossing the neck line, the price is moving upwards, which implies for another interaction with the green bearish trend line. In this case, the orange support, which indicates the last bottom of the price, would be a crucial level for the eventual decrease of the price.
USDCHF:
After the price confirmed the double bottom formation with crossing the blue neck line at 0.89521, a rising wedge formation was formed (white). A break in the lower level of the wedge occurred, which implies for a correction of the bullish movement. Furthermore, there is a slight bearish divergence between the recent movement of the price and the momentum indicator, which supports the eventual correction. For this reason, we believe that the price might eventually drop to the orange neck line of the already completed smaller double bottom formation.
AUDUSD:
After the bearish break through the orange bullish trend line, the price started a consolidation, which reminds on a double top formation, but the price found support in the neck line of the formation. Currently, there is a potential for another formation – a bullish pennant, which is in a contradiction with the double top formation. The bullish pennant consists of the green bearish trend line and the neck line of the double top formation. For this reason, we are careful for breaks in both directions. If the pennant gets broken through the upper level, we could say that the bullish scenario would dominate. If the neck line gets broken, the double top formation rules would be in force.
