Weekly technical analysis for 16 – 20.06
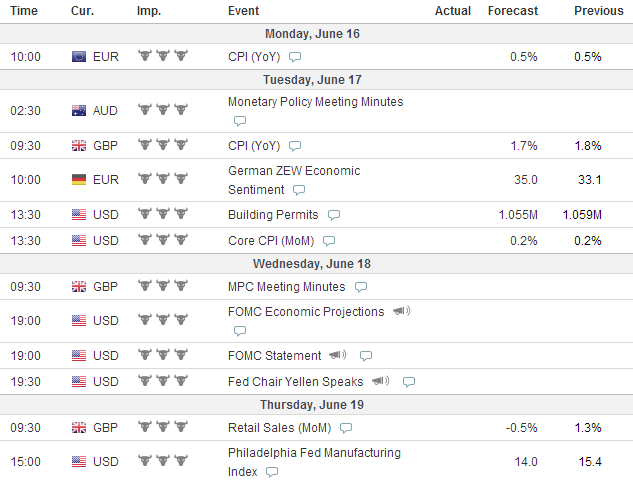
IMPORTANT ECONOMIC EVENTS DURING THE WEEK (GMT)
EURUSD:

On the D1 chart we notice that after crossing the 1.36710 blue neck line of the big green double top formation, the price started moving in a bearish corridor (orange). After bouncing from the upper level of the corridor, the price had just bounced from the lower level of the corridor, which implies that the pair might eventually return to the upper level of the corridor again, before making any other bearish movements. At the same time, there is a bullish divergence between the last bottoms of the chart and the momentum indicator, which supports an eventual bullish correction.
USDJPY:

After testing again the resistance at 102.723, the price did a bearish bounce, which sent it through the three times tested blue bullish trend line from May 21. The price even crossed in bearish direction the already broken dark blue bullish trend line from the beginning of February. At the same time, the momentum indicator broke in bearish direction from its yellow bullish trend line and then it tested it as a resistance, which supports the potential bearish movement we are discussing. For this reason, we believe that the price would eventually drop during the week and would probably meet the supports at 101.201 and 100.792.
GBPUSD:

After breaking through the upper level of the green bearish corridor from May 6 and at the same time, through the resistance at 1.68116, the price also broke through the already broken lower level of the blue bullish corridor from November 2013 and increased to the 5-years high of the price from one month ago. Afterwards, the price broke through the 1.69974 resistance, which indicate the 5-years high and now, it is about to test the top from 5 years ago. If the price breaks it, this would create a 6-years high. The resistance, which indicates the top from 5-years ago is located at 1.70547, which is not visible on the D1 chart, but on the W1. Having in mind that the price did such a significant bullish break, we could expect an increase at least to the top from 5-years ago at 1.70547. For this reason, we might see a bearish correction first. If the price increases even more, the already broken 1.69946 resistance might be turned into a support and the price might use this level in order to trigger itself in bullish direction. Another good support might appear to be the lower level of the already broken blue bullish corridor. The price might return there for a test and a bullish bounce.
USDCHF:

The price increased again to the upper level of the already broken rising wedge formation, and it bounced in bearish direction afterwards. Now the price is out of the wedge again. If the price drops, it would eventually meet the 0.89521 level, where it could be supported. After all, we should not forget that there is a big double bottom formation, which the price confirmed a month ago (purple). For this reason, it is likely to see the price following the double bottom formation, where the price has completed about 30% of the potential bullish movement yet. Currently, the momentum indicator is above, but almost on the 100-level line and it could be used as a trigger for a short position until the support at 0.89521. At the same time, there is a bearish divergence between the indicator and the chart of the price, which supports the bearish drop.
AUDUSD:

After the price broke through the green bearish line from April 10, which connects the last tops of the price, the Aussie is currently moving in a bullish direction toward the resistance at 0.94644, which indicates the 6-months high of the price. We would like to note, that the upward movement happens in a rising wedge formation, which, as we all know, has the potential to break in bearish direction. Currently, the price is testing the lower level of the wedge, which implies that a bullish bounce is likely to occur. This bounce could actually send the price to test the 0.94644 level. At the same time, the wedge would be to its end and the blue resistance in a combination with the bearish potential of the purple wedge, could send the price downwards.

Leave a comment