Archive for March 2014
Weekly technical analysis for 31.03 – 4.04
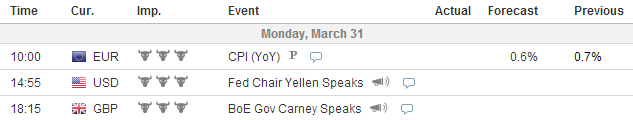
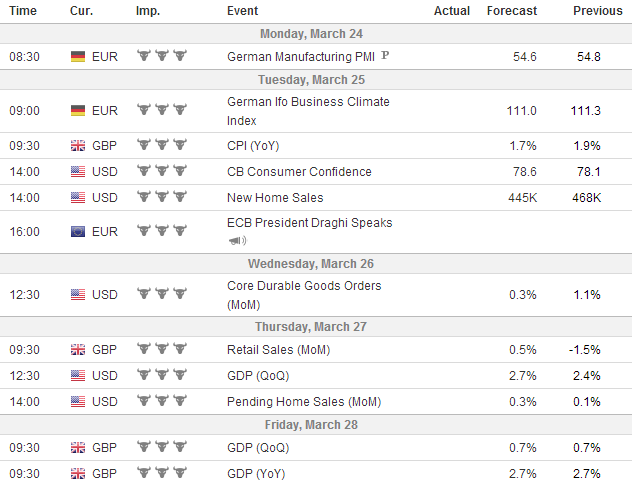
IMPORTANT ECONOMIC EVENTS (GMT)
EURUSD:

The blue bullish trend line brought the price through the 5-years turquoise bearish trend line. Two weeks after that, the price broke through the blue bullish trend line too and it returned to the 5-yrars turquoise bearihs trend line in order to test it as a support. Doing that, the price formed the trend changing formatioj Head and Shoulders (red lines) and it even crossed its Neck Line. This means confirmation of the formation and a potential for a drop with the size of the formation itself. The Momentum Indicator is under the 100-level line and signalizes for a current bearish movement. This might be a good moment to go short with a Stop Loss line above the second shoulder of the already confirmed formation.
USDJPY:
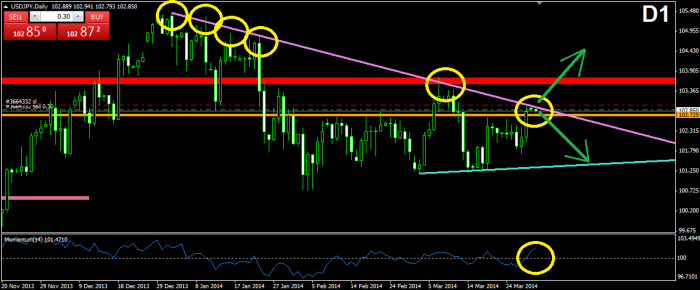
The price has increased to the 3-months purple bearish trend line in the last few days. Currently, we see a resistance of the pressure of the price for now. The interesting moment here is that the last few bottoms of the price could be connected with a line (turquoise), which closes a triangle with the purple resistance. The triangle looks like a symmetrical one, which means that the price might break in both directions. Since the price has just hit the purple bearish trend, the expected outcome is likely to be a drop to the lower level of the triangle (turquoise line). But at the same time, we have the Momentum Indicator, which supports the bullish movement for now. It might be better to wait for the indicator and the price to develop more in order to have a better idea of the situation and to go long or short.
GBPUSD:
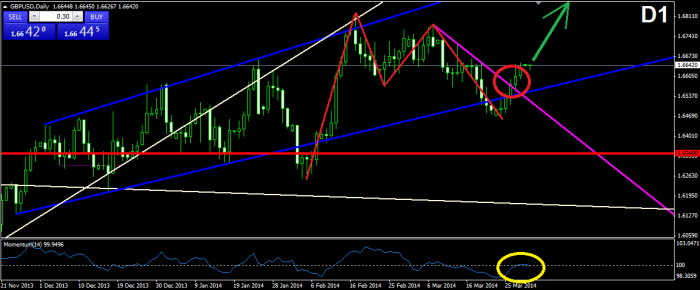
The drop of the price under the lower level of the blue bullish corridor was the last step of the price for the completion of the Double Top formation. Then, like in the previous drop, the price increased and showed signs that the new bullish movement might be here. The price crossed the purple bearish trend line, which indicates the bearish movement of the price after the Double Top formation. The Momentum Indicator is slightly above the 100-level line, which is another sign that the bulls might appear the stronger ones. For this reason, going long might be a good idea, which could turn into a profit with the size of the previous increase after the last drop under the lower level of the blue bullish corridor.
USDCHF:
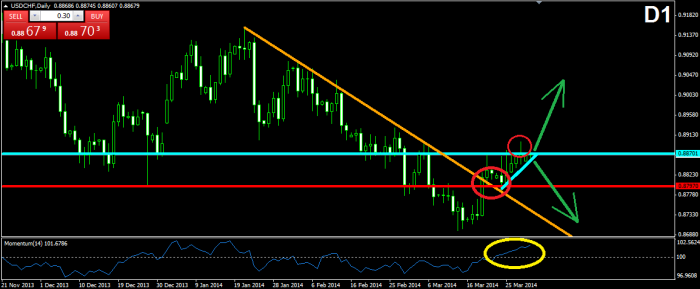
After moving under the bearish trend line (orange) for the last two months, the price did a bullish increase, which broke the orange trend line. A resistance, which indicates some of the previous bottoms and tops of the price was also broken at the same time when the trend line was broken. Then a consolidation appeared. The consolidation has the shape of a ascending triangle, which in most of the cases breaks in bearish direction. This time, the price did a clear bullish break through the upper level of the triangle, which means that this case might be an exception. The Momentum Indicator shows clear support for the bulls too. Anyway, we might want to wait for a while, in order to see if the price is really going to increase, or it will suddenly change its direction to bearish.
AUDUSD:
The price has started the expected bullish movement as a result of the inverted Head and Shoulders formation, which was confirmed about two weeks ago. The increase began and the price completed something like 1/3 of its potential. Now the price is correcting and we are probably going to see another bullish increase for another part of the expected bullish profit. The Momentum Indicator shows support for the bulls, but it could also do a correction in order to gain some more space for increase. For this reason, the best move here might appear to be the opening of a long position, right after the price does a clear bullish jump, which could easily be distinguished from its other candles.
Technical Analysis – 26/03/2014
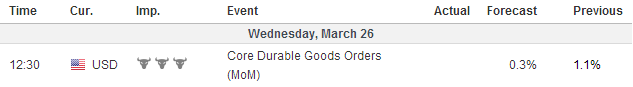
IMPORTANT ECONOMIC EVENTS (GMT)
EURUSD:

The price tested the 5-years bearish trend line (turquoise) for fourth time. The level stood up the pressure of the price and a bullish bounce occurred. The bounce is visible on the Momentum Indicator too, but after the price reached a certain level, after two hours it started dropping, while the Momentum Indicator continued with the higher tops and bottoms. In other words, this is a clear bullish divergence. In a combination with the strong support (the 5-years bearish trend), we might state that the price would most likely restore the bullish movement.
USDJPY:

The consolidation after the Double Bottom formation started resembling a symmetrical triangle (orange). The tops of the triangle are synchronized with the previous clearly stated top by a bearish trend line (turquoise). The Momentum Indicator is consolidating too. As we all know, the symmetrical triangle has the potential to push the price in both direction. Having in mind that the price is touching a bearish trend line, the most logical scenario would be a bearish bounce and a drop with the size of the triangle or to the support formed by the Double Bottom formation. On the other hand, we should be careful for bullish breaks. If such occurs, we might see the price testing the 3-months purple bearish trend line.
GBPUSD:

The price has returned to test as a resistance the already broken lower level of the blue bullish corridor (D1). The price bounced in bearish direction afterwards. The last two bottoms of the price could be connected with a line (light blue bullish line), which might have the potential to support the price. For this reason, one of the possible scenarios for the price is a drop to the light blue bullish line and a bullish increase afterwards. The interaction point between the lower level of the blue bullish corridor (D1) and the purple bearish trend line might be the next test zone of the price.
USDCHF:

After breaking in bullish direction through the upper level of the red bearish corridor, the price started a consolidation, which formed a resistance in the area around 0.88600 (pink). After the last interaction with this resistance, the price dropped for a test of the already broken upper level of the red bearish corridor as a support. The level stood the pressure of the price and currently we witness a bullish movement. The Momentum Indicator also signalizes for a bullish activity. For this reason, we believe that the price would most likely return to the pink resistance and having in mind the test of the upper level of the corridor as a support and the fact that during the last interaction with the pink resistance, the price did a little break, we believe that the price might even see a break through the pink resistance.
AUDUSD:

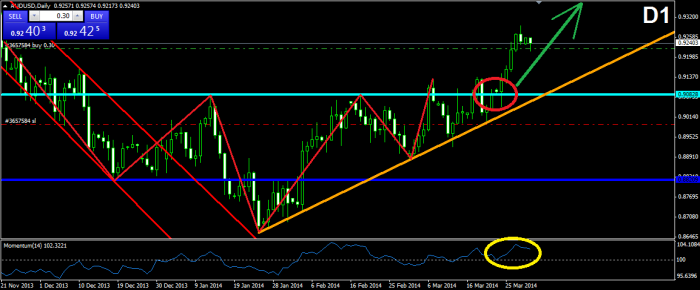
The price broke again through the Neck Line of the inverted Head and Shoulders formation on the D1 chart. Thereafter the price started moving after a bullish trend line (turquoise), which is probably beginning of the bullish effect owing the inverted Head and Shoulders formation. The Momentum Indicator also shows a slight bullish increase (light blue line), which has already moved above the 100-level line. For this reason, we believe that the price would continue following the turquoise bullish trend line for now. The situation looks pleasant for a long-term bullish position, which might lead to a profit of 300-400 pips.
Technical Analysis – 25/03/14
IMPORTANT ECONOMIC EVENTS (GMT)

EURUSD:

After dropping to the 5-years bearish trend line (turquoise) the price did an increase and another return afterwards. A Double Bottom formation was confirmed and completed at once (red), which made the Momentum Indicator to break rapidly through the 100-level line. The followed correction let us build the light blue bullish trend line, which does not have an important role yet but might turn into a significant measurement of the eventual bullish movement at any time. For this reason, as long as the price is above the blue bullish trend line, we might keep up the bullish mood.
USDJPY:

After confirming and completing the Double Bottom formation on H4, the price started a consolidation, which is still present. The tops of this consolidation might be connected with a line (orange), which could be used as a resistance and as a trigger of long positions. At the same time, the last four bottoms of the consolidation could also be connected with a slight bullish trend line (blue), which could be counted as a support for now. The price is currently on the blue bullish line, so we might see a jump to the orange resistance. At the same time, the Momentum Indicator has just crossed the 100-level line in bullish direction, which only confirms the potential of the eventual bullish activity.
GBPUSD:

After its last bounce from the purple bearish trend line, the price broke through the lower level of the blue bullish corridor (red circle), which is a bearish signal. A rapid return to the same level appeared afterwards and the price tested it as a resistance. The level resisted the price and a rebound occurred afterwards, which is another bearish signal. Currently, the price is consolidating (orange circle). The interesting is that the Momentum Indicator has just created a small but very clear divergence with the graph of the price (light blue tiny lines), which is our third bearish signal. Therefore, the expected outcome is a continuation of the bearish activity.
USDCHF:

After breaking in bullish direction through the red bearish corridor, the price did a small return and tested the upper level of the corridor as a support. The level stood up the pressure of the price and a bullish bounce occurred. The price reached a certain level, it did a correction and the same level was reached for a second time. This let us build the pink resistance you see on our chart. A bearish bounce occurred afterwards and the upper level of the corridor was tested again. Currently, the price is consolidating, where its last 4-5 candles are creating almost a horizontal movement, while the momentum indicator has just exploded in bullish direction (blue lines). The bullish signals we described and this divergence are a sufficient reason to believe that the price might increase at any time.
AUDUSD:

After bouncing from the purple bullish trend line, the price started a sharper increase, which is now correcting. As we see, the price has stopped its correction at 23.6% Fibonacci Level, which infers that the price might continue its bullish activity. At the same time, we have a clear bearish divergence, between the chart of the price and the Momentum Indicator (blue lines). Furthermore, the Momentum Indicator has just crossed the 100-level line in bearish direction. For this reason, we might wait for the price to either cross the 23.6% Fibonacci level in bearish direction in order to go short for a shorter term position, or to wait for the price to break through the 0.00% Fibonacci Level in order to go long. We remind that on D1 the price still has the inverted Head and Shoulders formation’s scenario.
Weekly technical analysis for 24 – 28.03
IMPORTANT ECONOMIC EVENTS (GMT)
EURUSD:

The price broke through the 20-days bullish trend line (purple) and dropped to the area of the 5-years bearish trend line (turquoise). Now it looks like the price is being supported by this level, which is something that cannot be said for sure. For this reason we do not exclude any of the two possible movements. We would like to note that the Momentum Indicator is still pointing the bearish direction as a potential future movement of the price, which is the only sign, which provides some kind of domination to one of the possible scenarios. Therefore, the best move here might be to wait for the price to develop on the graph, which might bring us more signs and signals for opening a position.
USDJPY:

It looks like the last three bottoms on the D1 chart have formed a bullish resistance, which is closing a triangle with the purple bearish trend line from the end of December. It is too early to talk about a break in the triangle so, the movement of the price inside its frames would be the topic of our analysis. The upper level of the triangle looks like the stronger one, because it has been tested six times, while the lower level of the triangle is tested only three times. Also, we should not forget that the last interaction and bounce of the price from the lower level of the triangle was created by means of a Double Bottom formation, which was an indication for the change in the direction. Since the price started a strong bullish movement after the last interaction with the lower level of the triangle, we expect the price to return to the purple bearish trend (the upper level of the triangle). The price could do this with breaking through the green resistance or with testing the green resistance and the purple bearish trend at one. This could be done in the orange circle, which indicates the interaction of the two levels.
GBPUSD:

The price is still moving after the Double Top formation on D1, and as we forecasted, it broke again through the lower level of the blue corridor. The price has completed around 2/3 of the potential bearish activity, which hints that the price would most likely continue its bearish movement in order to reach its potential target. As we see, after the second top, the price has created a bearish trend line, which guides the price in its bearish journey. The line has been tested for three times and having in mind that the last test was relatively long ago and the price is a bit distant from the trend, it is likely to see a return to the trend before any continuation. The Momentum Indicator is in its lowest positions, which supports the eventual correction we just discussed.
USDCHF:

The price went out of the red bearish corridor during the last week. There was a triangle (yellow) inside the corridor, which pushed the price in bullish direction and caused the bullish break (red circle). Then the price started consolidating with forming something like a triangle (blue), where the upper level is not very clear. The ascending bottoms and the descending tops support the triangle theory in this case. For this reason we expect a break, which is possible to be in both directions. In other words, the price might break in bearish direction in order to test the already broken upper level of the red bearish corridor, or it could directly start the new bullish movement. The Momentum Indicator supports the bulls.
AUDUSD:

We see no significant change in the situation by this pair. The price still strives to start its bullish movement after the already confirmed inverted Head and Shoulders formation. As we see, the price records a slight increase in its tops, which is still not what it is likely to happen. The Momentum Indicator is the instrument, which demonstrates the potential strength, which the price might demonstrate in bullish direction. The Momentum Indicator shows a clear bullish activity, following a bullish trend line and the key moment was few hours ago, when after breaking through the 100-level line, the indicator returned to test the light blue trend line and the 100-level line as a support at once. A small bounce appeared afterwards (yellow circle). This is a proof of the bullish strength, which we might witness during the week.
Technical analysis for 20/03/2014
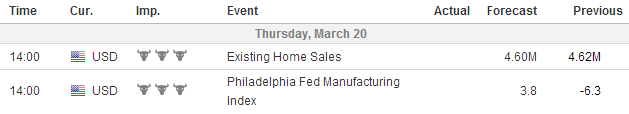
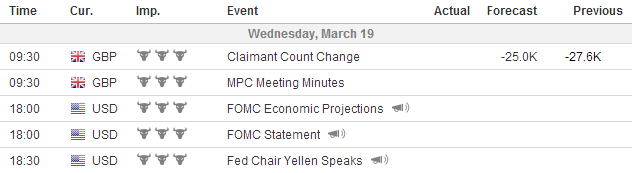
IMPORTANT ECONOMIC EVENTS (GMT)
EURUSD:

After the drop from its 29-months high, the price started a consolidation with a triangle shape, or to be more specific, a bearish pennant. After the third test of the lower level of the formation, yesterday the price did a rapid break and dropped to the 45-days bullish trend line (red). Since there was an interaction between the red bullish trend line and the 5-years bearish trend line (turquoise support), the price managed to test the both levels at once, which gives additional strength to the level of support. So, the price looks supported for now, which infers that a potential rebound is possible.
USDJPY:

After the price reached the the turquoise support for third time, it started increasing slightly, and not long after that, it exploded in bullish direction, which confirmed and completed the Double Bottom formation (red lines) we mentioned about. The price reached the resistance at 102.725 and started a correction, which resembles a bullish pennant (orange lines). Since we have a clear bullish activity and a bullish pennant afterwards, it is normal to expect the price to continue its ascendance.For this reason, we watch out for a break in the upper level of the formation, which could be used as a trigger of a long position.
GBPUSD:

The price completed more than half of the expected bearish movement. We remind that on D1 the price confirmed a Double Top formation, which was the reason for the bearish expectations. In the last two days, the price did the drop we are talking about and we notice that the bearish movement was happening in the frames of a bearish corridor (turquoise). This bearish corridor brought the price to the blue bullish corridor on D1 and the price is currently testing its lower level. Since the price has about 1/3 from the expected bearish move to take, we expect it to go beyond the lower level of the blue bullish corridor. Furthermore, the current correction of the price resembles a bearish pennant. For this reason, the price might continue moving into the turquoise bearish corridor and it could break the blue bullish corridor (D1).
USDCHF:

The price increased again to the 2-months orange bearish trend line and it is currently testing it for sixth time. The consolidation after the interaction with the trend line resembles a symmetrical triangle (yellow), where, as we all know, is possible to see a break in both directions. Since the price is testing a strong bearish trend line, it is likely to see the break in bearish direction. Actually, we even see the beginning of this break now. The price is slowly getting out of the symmetrical triangle and it is decreasing slightly. For this reason, the price looks like resisted from the orange bearish trend line and a drop is likely to occurr.
AUDUSD:

After the steady increase for the last week, yesterday the price did a rapid drop, which ended on the purple bullish trend line, which is a connector of the bottoms by the Head and the second Shoulder of the inverted Head and Shoulders formation on D1. As we all know, the Neck Line of the formation is already crossed, which confirms the formation and the expected outcome is likely to be an increase of the price. If we look at the chart on D1, we notice that this increase really exists, but it is slight. Maybe we are going to see a bullish explosion, which would push the price to create the beginning of the potential bullish movement. Anyway, the price has just bounced from the purple bullish trend line on H1, so this might be interpret as a pleasant opportunity to go long.
IMPORTANT ECONOMIC EVENTS (GMT)
EURUSD:

On H1, the last four tops of the price have created a Resistance (yellow line). The yellow Resistance and the purple bullish trend line are forming a symmetrical triangle formation, which, as we all know, has the potential to push the price in both directions. Since the purple bullish trend line is quite older than the yellow resistance, it is more likely to see the price going through the Resistance, rather than through the older purple bullish trend. Furthermore, we have the Momentum Indicator, which indicates potential bullish activity.
USDJPY:

With the third drop of the price to the turquoise Support, the already confirmed inverted Head and Shoulders formation (red) appeared to be fake. Despite of the fact, that the price crossed the pink Neck Line of the formation, the drop appeared and the price hit the Stop Loss lines of many traders. This is just an example of what the Forex Market is capable of. Anyway, after bouncing from the turquoise support for third time, the price started increasing, which created the idea of a potential Double Bottom formation (yellow). As you see on the chart, the price started a move toward the Neck Line (yellow horizontal) of the potential formation. Furthermore, the Momentum Indicator supports the bullish activity.
GBPUSD:

As we guessed yesterday, the price broke through the lower level of the purple triangle. It dropped to a certain level (dark blue), and then it returned to the lower level of the triangle in order to test it as a resistance. The level resisted and the price dropped through the dark blue support, which indicates the previous bottom. This movement confirmed a change in the trend. After creating a new, lower bottom, the price started a bullish movement, which as we see, is currently slowing down (light blue curved). The Momentum Indicator has crossed the 100-level line in bullish direction, but it looks like indicator is also slowing down and might change its signalization. For this reason, we believe that the last bullish movement is probably a correction of the new bearish activity, and the price is going to drop again.
USDCHF:

The Price crossed the upper level of the purple symmetrical triangle, as we guessed yesterday. Then suddenly, the price returned back to the lower level of the triangle, where it found support. On first sight, we do not have many signals, which support a further movement. If we take a closer look we notice few important bullish signals: 1) a break in the upper level of the symmetrical triangle; 2) a break in the previous two tops of the price and the creation of the new, higher top; 3) another support on the lower level of the purple triangle; 4) an interaction in bullish direction of the Momentum Indicator with the 100-level line. For this reason, our guess supports the bulls.
AUDUSD:

It looks like the price started the bullish movement we were looking for in the past week. We were looking for it, because it is expected to happen as a result of the already confirmed inverted Head and Shoulders formation on the D1 and W1 charts. Despite of the started bullish movement, it might be a time for a correction now. The price reached a 3-months high yesterday, then it created a small Double Top formation, the Momentum Indicator crossed the 100-level line and a small drop occurred. We believe that this circumstances would bring the price to the turquoise bullish trend line, where the eventual bounce would push the price to new highs.
Weekly technical analysis for 17 – 21.03
IMPORTANT ECONOMIC EVENTS (GMT) 
EURUSD
:  After breaking through the blue bullish trend line, the price created the impression that it would change the direction of its movement. Actually, this did not happen. Right on the contrary, the price created a new bullish trend line (purple) right under the already broken blue bullish trend line. The price tested the purple bullish trend line for three times and now it is about to test it for fourth time. Actually, the already broken blue bullish trend line and the purple bullish trend line form something like a bullish corridor, which the price conforms to. The Momentum Indicator signalizes a strong bullish activity. Since the price broke the 5-years light blue bearish trend (red circle), we assume that the price would most likely continue its bullish movement. We would like to just note that it is likely for the price to break the purple bullish trend line in order to return to the already broken light blue bearish trend line, in order to test it as a support.
USDJPY:

The price did a rapid drop during the last week, after it met the 3-months bearish trend line (purple). In the last day days of the drop, the price interrupted the blue support at 101.586. The followed Falling Wedge formation (H1) is currently pushing the price in bullish direction. If a clear break in the already broken blue support (currently a resistance) occurs, we could expect a bullish movement of the price to the purple bearish trend. The other scenario would be to see a bounce prom the blue resistance and a new bearish movement afterwards. The Momentum Indicator is about to cross the 100-level line in bullish direction.
GBPUSD:

After bouncing from the upper level of the blue bullish corridor, the price started a bearish move which, was partly interrupted for a bullish return. The second bearish movement revealed the Double Top scenario, which we are currently seeing. The price crossed the Neck Line of the Double Top formation during the last week, which confirmed the figure. At the same time, the Momentum Indicator crossed the 100 level line in bearish direction, which is another signal for an upcoming bearish activity. If the price start moving after the formation, we would most likely see a break in the lower level of the blue bullish corridor, right like in the previous bottom, which was supposed to be “on” the line (big red circle).
USDCHF:

On D1 chart we notice the red bearish corridor, which has been dominant during the last two months. We would like to remind that this corridor decreased the price of the pair with $0.0321 = 321 Pips and it proved to be a stable regulator of the price. During the end of the last trading week, the price has bounced from the lower level of the corridor and now the price is about to meet the upper level of the corridor, where we will look for a resistance. The Momentum Indicator is about to cross the 100-level line in bullish direction.
AUDUSD
:
The price has not still started its movement after the Inverted Head and Shoulders formation, which you see on the D1 chart. After its last interaction with the purple bullish trend line the price started a bullish movement, which would probably push the price in bullish direction now. The Momentum Indicator crossed the 100-level line in bullish direction and gives clear bullish signal. After all, if the price starts the bullish movement after the Inverted Head and Shoulders formation, the bullish movement might be located on the purple bullish trend line. So, do not be surprised if the price moves slightly. 🙂
Technical Analysis – 12/03/14
EURUSD:

After the interaction with the already broken blue bullish trend line as a resistance, the price did a rapid bearish bounce and then it began a slight bearish movement between the pink lines. As we see, this movement has the ability to meet the price with the already broken turquoise 5-years bearish trend line and even with the purple bullish trend line. For this reason, since there are two levels, which the price might conform with, we believe that they are a strong factor for the attraction of the price. The Momentum Indicator is consolidating too. Any break in the pink corridor, or a rapid movement of the Momentum Indicator would mean that the price is most likely taking a direction. For this reason, it might be good to open a position in case of such occurrence.
USDJPY:

The price bounced in bearish direction from the purple bearish trend line as we mentioned yesterday. The price met the green support at 102.793 afterwards and tested it two more times with no success for now. Actually, the 102,793 support is also a Neck Line of a Head and Shoulders Formation (red), which looks like a great continuation of the current events by this pair. Since the turquoise bullish trend line brought the price to meet the purple bearish trend line and then the turquoise bullish trend line got broken, the Head and Shoulders formation is a great way to continue the change in the trend. For this reason, it would be good to go short in case of a break in the green support.
GBPUSD:

After breaking in bearish direction through the small yellow triangle, the price did a bearish movement and then started forming another bigger triangle with symmetrical shape. As we all know, the symmetrical triangle has the ability to push the price in both directions. In this case we also have the Momentum Indicator, which has just crossed the 100-level line in bullish direction. This tilts the scales in bullish direction. Of course this gives no guarantee that the price will break in bullish direction. It just suggests that the Momentum Indicator supports the bulls for now.
USDCHF:

The price bounced from the upper level of the red bearish corridor and then it started the strong bearish movement, which we saw later. The price did not manage to reach the lower level of the corridor and started consolidating in advance. The consolidation is happening in the frames of a symmetrical triangle, which as we all know has the ability to move the price in both directions. Again, like in the previous case with the GBPUSD pair, we have the Momentum Indicator which supports the bulls. We wait for a break in the triangle in order to open a position. Would the price return to the upper level of the corridor or it will manage to drop to the lower level of the corridor in order to follow the order of the swings?
AUDUSD:

After breaking in bullish direction through the 0.90826 Resistance and confirming the inverted Head and Shoulders formation, the price dropped to the interaction point of a bearish line which connects the last few bottoms of the price, and the bullish line, which connects the Head and the Second Shoulder on the D1 chart. Having in mind that the both lines have the potential to push the price in bullish direction and the already confirmed inverted Head and Shoulders Formation, which as we all know has bullish potential, we believe that the price might start following the formation’s rules now. Furthermore, the Momentum Indicator is about to cross the 100-level line in bullish direction.
Weekly technical analysis for 10 – 14.03
IMPORTANT ECONOMIC EVENTS DURING THE WEEK (GMT)

EURUSD:

After its bounce from the orange resistance at 1.37711 and the followed break through the blue bullish trend line, the price created the impression that a bearish movement is about to come. Despite of that, the price bounced from the upper level of the already broken red bearish corridor started a bullish movement, which broke the orange resistance 1.37711 and even the 5-years turquoise bearish trend line. Now for a second time the price is testing the blue bullish trend line as a resistance. This time, there is a bearish divergence between the price’s chart and the Momentum Indicator. This divergence could change the direction of the price or it could just force the price to test the 5-years turquoise bearish trend line as a support and then the bullish movement to be renewed.
USDJPY:

Having in mind that for fourth time the price met the purple bearish trend line and it even bounced from it, it could be said that the Double Bottom formation, which brought it there is completed. It looks now that the bounce from the purple bearish trend line is about to change the direction of the price. We do not say that the price could not break the line. It is just that the line is now being test for the fourth time and it is more likely to believe in the bounce as a regular tendency for the past 2 months. On the other hand, when the price was bouncing in bearish direction from the bearish trend line, the Momentum Indicator was crossing the 100-level line in bullish direction, which plays as a bullish divergence. But as we all see, the divergence is extremely small and it could not affect the price’s movement.
GBPUSD:

After reacting with the upper level of the blue bullish corridor, the price bounced in bearish direction. After dropping a bit, the bearish movement started turning into a horizontal movement, which gave a hint for building the orange bullish trend line. So, as we see now, it looks like the price is being supported by the orange bullish trend line. At the same time, the Momentum Indicator has crossed the 100-level line in bullish direction which is another sign for an upcoming bullish movement. Furthermore, after the upper level of the blue bullish corridor, the price was supported by the 38.2% Fibonacci Level. If the price bounces from the orange bullish trend line, the price might reach again the upper level of the corridor, or it could even break through the upper level of the blue bullish corridor.
USDCHF:

With breaking the red support at 0.87969, which created a new 30-months low. After creating this new bottom, the price returned for a test of the orange bearish trend line, which brought the price in this position. A bearish bounce occurred and now the new lower bottom is a fact.For this reason, a return to the orange bearish trend line is possible and every bottom could be perceived as a potential support, which could change the direction of the price at any time. The orange trend line gives us the option to trade the bearish bounces from the line. The Momentum Indicator is still under the 100-level line, which is another bearish signal.
AUDUSD:

On D1 chart we notice that in the period between the break of the price out of the red bearish corridor and today the price has created a clear inverted Head and Shoulders formation, which with crossing the turquoise Neck Line got confirmed during the last week. Despite of the current small bearish movement of the price, we believe that the price will reach the orange bullish trend line which would give the price the needed bullish push in order to start moving after the bullish formation. If the price hits the orange bullish trend line, this could appear to be the best moment to go long for a longer term. We remind that according to the Head and Shoulders formation rules, in this case we could expect a bullish movement from at least 430 pips. If we manage to go long while the price is under the Neck Line (for example now), this could lead to even better outcome.
Weekly technical analysis for 3 – 7.03
IMPORTANT ECONOMIC EVENTS (GMT)

EURUSD:

After testing the resistance at 1.37715, the price has bounced in bearish direction and has broken through the blue bullish trend line (red circle). After this happened, the price returned to test the blue bullish trend line as a resistance, and at the same time, the 5-years turquoise bearish trend. Having in mind that the price jumped in bearish direction from the interaction point of the two lines (yellow circle), we assume that it is more likely for the price to change its direction and to start a new bullish movement. Maybe this is a nice moment to go short for a longer term.
USDJPY:

The price bounced for a second time from the green resistance at 102.793. The followed bearish movement brought the price through the pink bullish trend line from the beginning of February and the blue support at 101.586, which are crucial levels for the future movement of the price. At the same time, we have the Momentum Indicator, which with interrupting its regular bullish movement has just crossed the 100-level line in bearish direction. This is another bearish signal, which supports the idea of an eventual downward movement.
GBPUSD:

After bouncing from the upper level of the blue corridor, the price dropped to 38.2% level of Fibonacci (yellow circle). The price started a bullish trend afterwards. This action has created a bearish divergence between the price and the Momentum Indicator. The Momentum Indicator has continued with the bearish scenario, while the price has bounced from 38.2% level of Fibonacci and has started a new bullish movement. For this reason we believe that the price might basically move in bearish direction and the price could react with the important levels in one interaction point (purple) and then it could do a drop, which could even confirm a double top formation.
USDCHF:

The price is still moving between the red levels of the bearish corridor. The latest interaction of the price with the level was the lower level of the red corridor. Furthermore, it looks like the support has stood the pressure of the price and a new bullish movement might occur. Of course it is not necessary the increase to reach the upper level of the corridor, which also did not happen even the precious time. Furthermore, the Momentum Indicator has registered a slowdown, which could also be counted as a bullish signal. An eventual break through the lower level of the red corridor would of course defeat this theory.
AUDUSD:

The pink lines on the graph infers of a possible inverted Head and Shoulders formation. The price is now in the blue bearish corridor and it has just found a support in the lower level. It still cannot be said if the price was really supported by the level, because the Momentum Indicator did a clear cross of the 100-level line in bearish direction. For this reason it would be good to demonstrate some patience and to wait for additional signals in order to open a position during the week. If the price breaks through the lower level of the blue corridor this could mean a new drop at least until 0.88209 (red).
