Weekly technical analysis for 2 – 6.06
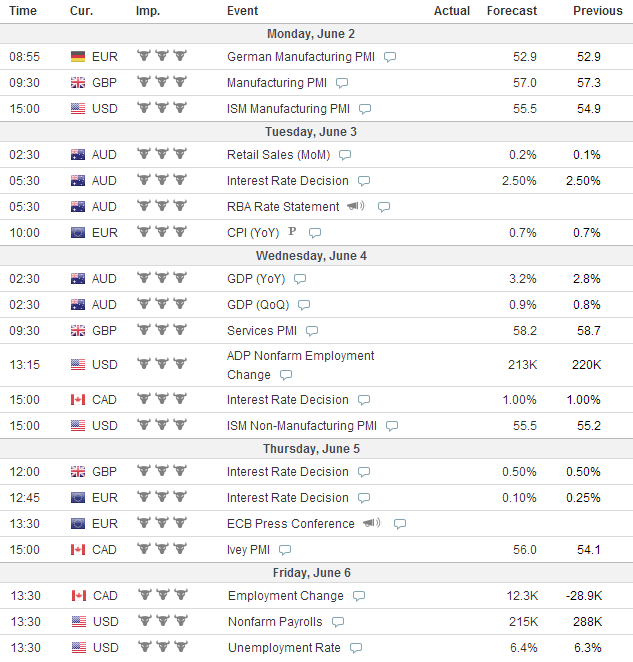
IMPORTANT ECONOMIC EVENTS DURING THE WEEK (GMT)
EURUSD:
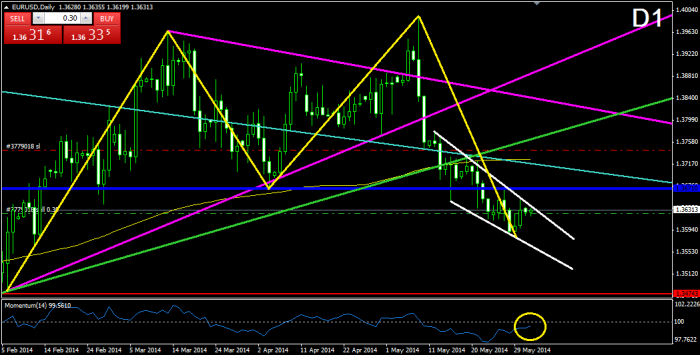
After breaking through the lower level of the purple triangle on D1, the price confirmed a double top formation (D1) and the followed bearish movement formed a falling wedge formation, where the price is currently testing the upper level of the formation. At the same time, the momentum indicator is about to cross the 100-level line in bullish direction. For this reason, we believe that the price might do a correction to the already broken neck line of the double top formation (blue) and even to the turquoise bearish trend line from 2008.
USDJPY:
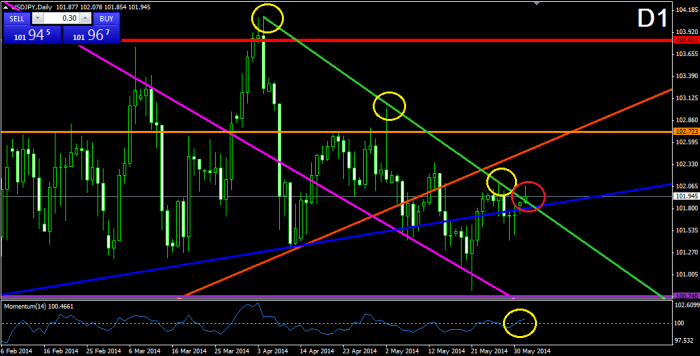
After the last bullish bounce from the already broken purple bearish trend line from December 2013, the price increased to the green bearish trend line from April 04. The green bearish trend got broken in bullish direction. At the same time, the momentum indicator has crossed the 100-level line in bullish direction, which supports the eventual bullish break and the eventual bullish movement. If this happens, the price is expected to reach at least the orange 102.723 resistance.
GBPUSD:
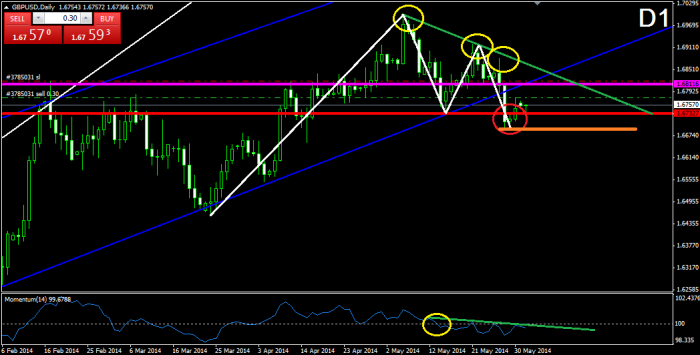
The price formed a 3-times tested bearish trend line (green), which was formed on May 6, where after the last bounce, the price confirmed a double top formation with crossing the neck line at 1.67327. At the same time, the momentum indicator confirms the current bearish movement with a trend line, and with the interruption of the 100-level line in bearish direction. Currently, after crossing the neck line, the price is moving upwards, which implies for another interaction with the green bearish trend line. In this case, the orange support, which indicates the last bottom of the price, would be a crucial level for the eventual decrease of the price.
USDCHF:
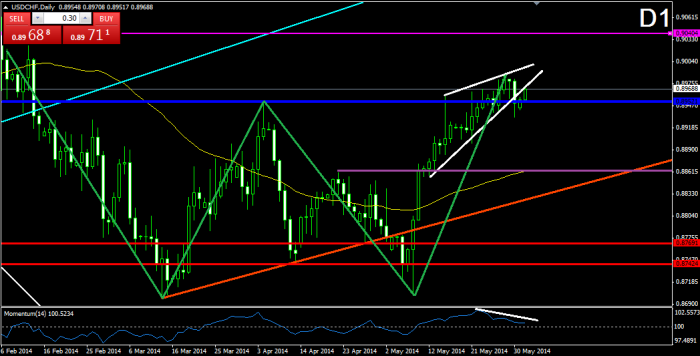
After the price confirmed the double bottom formation with crossing the blue neck line at 0.89521, a rising wedge formation was formed (white). A break in the lower level of the wedge occurred, which implies for a correction of the bullish movement. Furthermore, there is a slight bearish divergence between the recent movement of the price and the momentum indicator, which supports the eventual correction. For this reason, we believe that the price might eventually drop to the orange neck line of the already completed smaller double bottom formation.
AUDUSD:
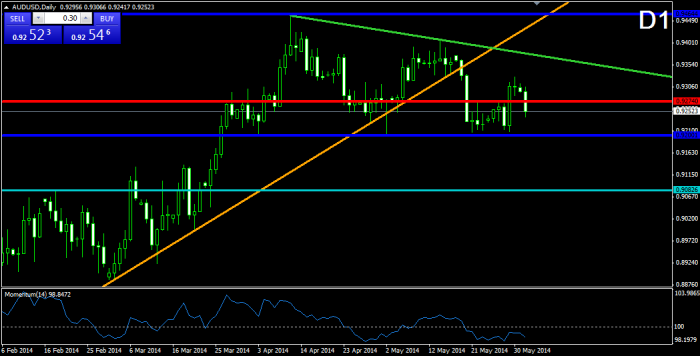
After the bearish break through the orange bullish trend line, the price started a consolidation, which reminds on a double top formation, but the price found support in the neck line of the formation. Currently, there is a potential for another formation – a bullish pennant, which is in a contradiction with the double top formation. The bullish pennant consists of the green bearish trend line and the neck line of the double top formation. For this reason, we are careful for breaks in both directions. If the pennant gets broken through the upper level, we could say that the bullish scenario would dominate. If the neck line gets broken, the double top formation rules would be in force.

Leave a comment