Archive for May 2014
Weekly technical analysis for 26 – 30.05
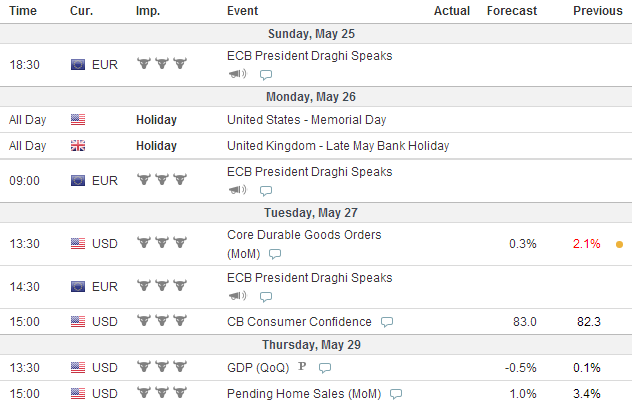
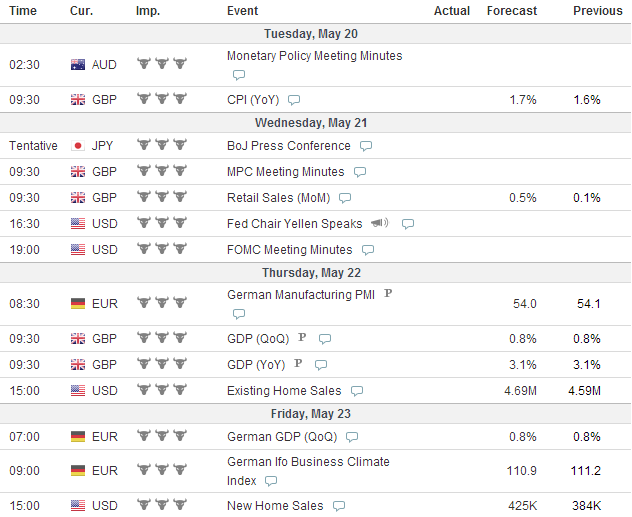
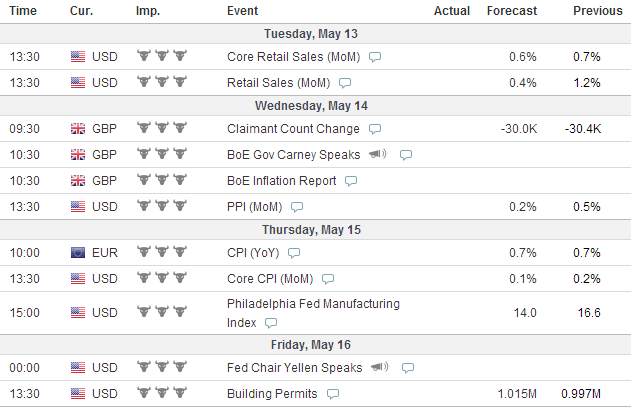
IMPORTANT ECONOMIC EVENTS DURING THE WEEK (GMT)
EURUSD:
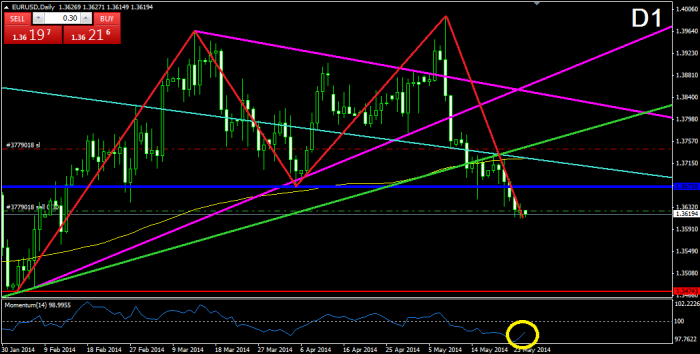
After breaking through the green bullish trend line from July 2012, the price decreased even more and it also broke through the blue 1.36710 neck line of the red double top formation on D1, which is a confirmation of the figure. For this reason, it is likely to expect the price to drop to the support at 1.34743 in the near future. Currently, the price is signing a slight slowdown of its bearish movement. At the same time, the Momentum Indicator signalizes for a decrease in the bearish activity. For this reason, we might see a bullish correction, which could meet the price with the blue level at 1.36710, or with the already broken turquoise 6-years bearish trend line.
USDJPY:
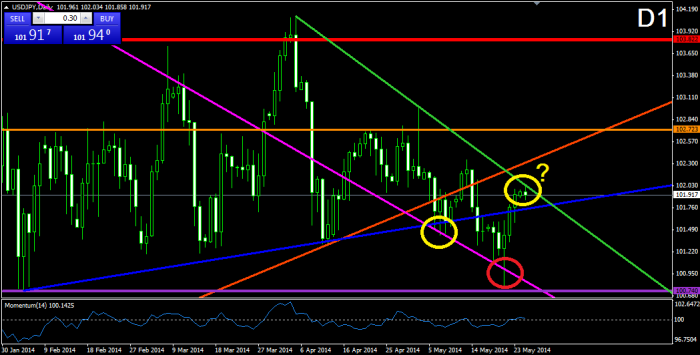
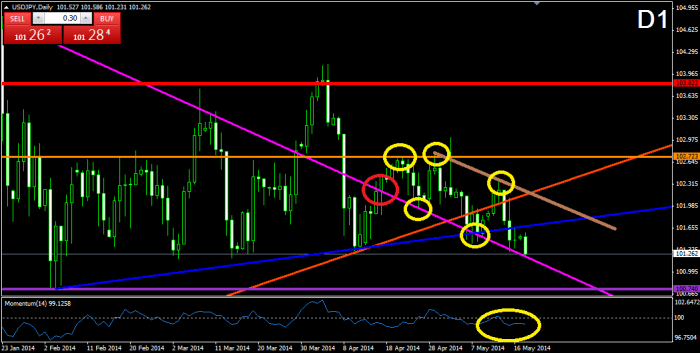
After breaking through the blue bullish trend line from February, the price decreased twice to the already broken purple bearish trend line from December 2013 and tested it as a support, where the second time, the price even broke the purple bearish line and it reached the purple support at 100.740. The followed bullish bounce during the last week increased the price and created a top, which formed the green bearish trend line from April 04. Currently, the price is testing this trend as a resistance and a bearish bounce is expected. For this reason, we believe that the price would decrease again to the 100.740 support and this time it could even break it. The momentum indicator is around the 100-level line and it could cross it again in bearish direction at any time.
GBPUSD:
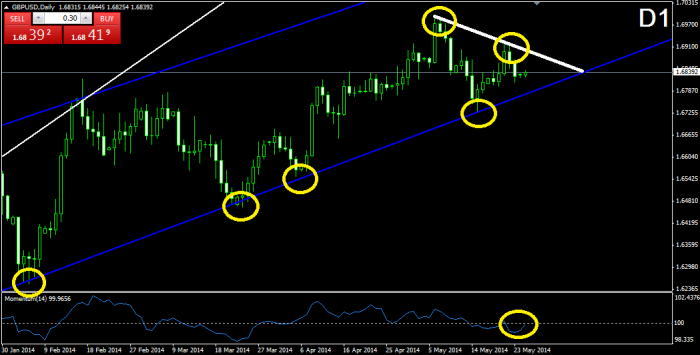
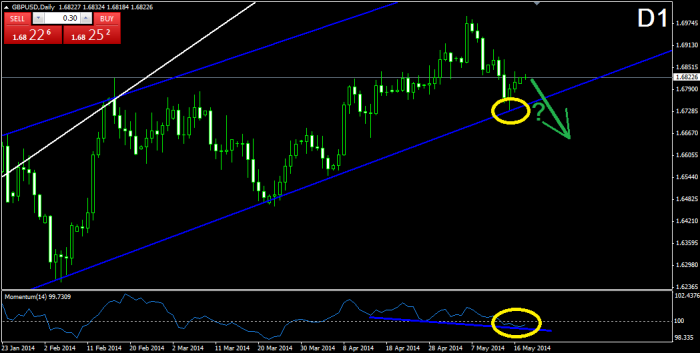
After the bounce from the lower level of the blue bullish corridor (W1), the price increased and created a top, which is actually lower than the previous one. This allows us to draw a bearish line between the two tops, which could be considered as a potential resistance. If the price breaks through the white bearish line, we could expect another increase to 1.69700, which could even push the price even higher – to the upper level of the blue bearish corridor for example. At the same time, the momentum indicator is on the 100-level line and it is testing it as a resistance now. A bullish cross of the 100-level line would support the bullish scenario. If the price breaks eventually through the lower level of the blue corridor, we might see the beginning of a new drop, where every previous bottom would be considered as a potential support.
USDCHF:
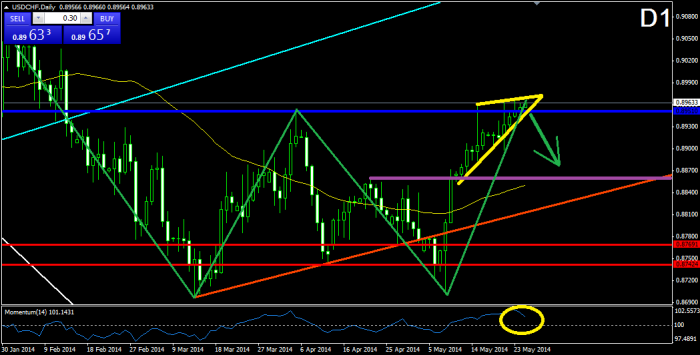
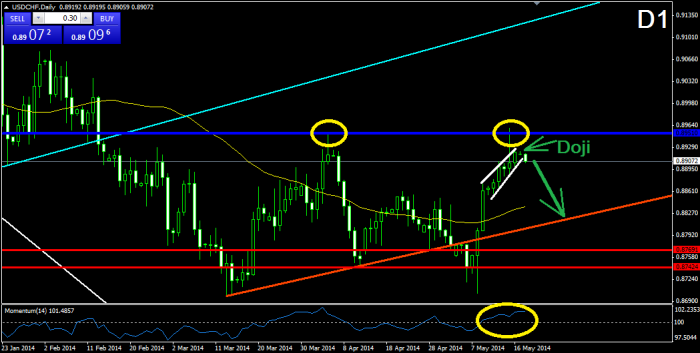
During its last increase, the Swissy has decreased the intensity of its bullish movement recently and the price has formed a rising wedge formation, which crossed the neck line of the big double bottom formation while forming. The interruption of the blue neck line at 0.89510 speaks of a overall bullish increase, but the rising wedge formation implies that a correction of the bullish activity might occur. As we know, the rising wedge has the potential to push the price in bearish direction to a distance equal to the size of the formation. For this reason, we believe that the price might drop to the already broken purple neck line of the smaller double bottom formation, and to test it as a support before any increase. The momentum indicator has already changed its direction.
AUDUSD:
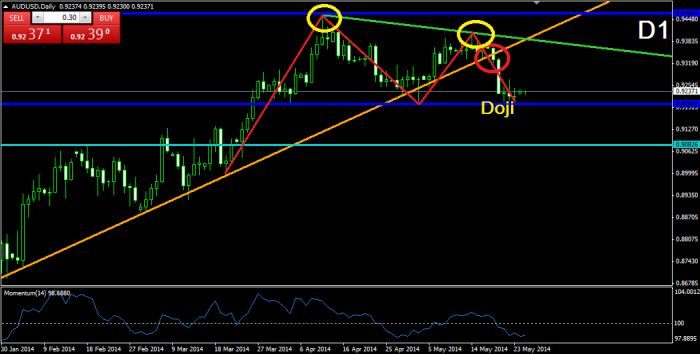
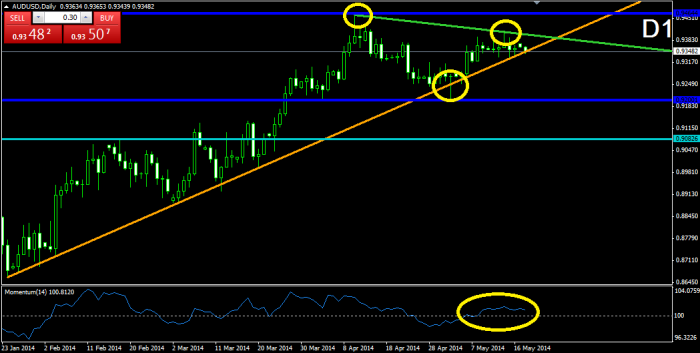
After breaking in bearish direction through the orange bullish trend line from January, the price decreased to its previous bottom at 0.92001, which is shown as a blue support on the chart. It is obvious that the price is finding support there, which infers that a new bullish bounce might occur. Furthermore, the price has closed a Doji candle, which supports the eventual change of the direction. Moreover, after it reached its lowest levels, the momentum indicator is currently switching its direction. For this reason we believe that the double top formation will wait for a while and the price would eventually increase to the green bearish line, which connects the last two tops of the price.
Weekly technical analysis for 19 – 23.05
IMPORTANT ECONOMIC EVENTS DURING THE WEEK (GMT)
EURUSD:
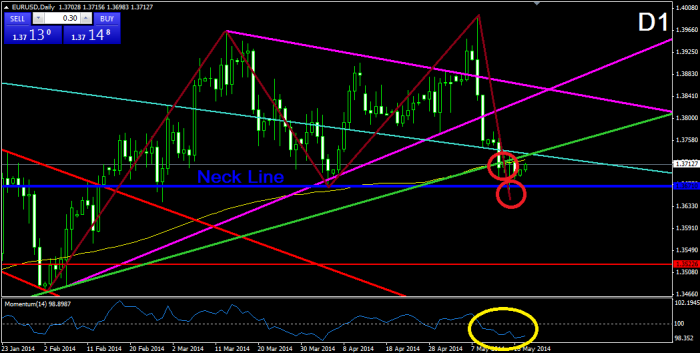
After getting out of the purple triangle, the price did a rapid decrease, which created a double top formation and the price broke the Simple Moving Average 150, the green 2-years bullish trend line and the 1.36710 neck line of the double top formation on a later stage. This has confirmed the double top formation and now we have a sufficient reason to believe that the price might drop to 1.34660. At the same time, the momentum indicator is getting exhausted in its bearish movement, which could mean that a bullish correction is about to appear before the expected bearish movement.
USDJPY:
After decreasing to the interaction point of the already broken purple bearish trend line from the end of December 2013 (W1) and the blue bullish trend line from the beginning of February, the price did a correction to the orange bullish trend line from March 2013, and a new bearish decrease, which broke the blue bullish trend line and met the price with the already broken purple bearish trend line again, where the price is being supported now. For this reason, we believe that the price is about to do a bullish correction again. A possible resistance for the target of the correction would be the brown bearish trend line, which connects the last two tops of the price and is parallel to the already broken purple bearish trend line.
GBPUSD:
During its last increase, the cable did not manage to meet the upper level of the blue bullish corridor it has been following in the last six months. The price even dropped and met the lower level of the corridor, which signalizes for a decrease in the intensity of the general bullish activity. At the same time, the last bottoms of the price are in a bearish divergence with the bottoms of the momentum indicator. Furthermore, the momentum indicator has also crossed the 100-level line in bearish direction, which supports the bearish idea. Anyway, remind that the lower level of the bullish corridor is an old and strong level, which would be hard to be broken.
USDCHF:
As we see, the price did a bullish increase to the 0.89510 resistance in a rising wedge formation, where it did a bearish bounce and the rising wedge formation got broken in bearish direction. Another bearish signal is the Doji candlestick which was formed before the current bearish candle. As we all know, the Doji candle means that the bullish and the bearish forces are equalized and a change in the trend might occur. Furthermore, the momentum indicator is in its top positions and it would soon start dropping too. For this reason, we believe that the price would decrease at least to Simple Moving Average 50. The next possible supports are the orange bullish trend line from the middle of March, the red supports at 0.87691 and 0.87424.
AUDUSD:
After bouncing from the orange bullish trend line from January, the price increased and formed a top, which is lower than the previous and which forms a bearish line (green). This green bearish line and the orange bullish trend form a triangle, which is about to get broken at any time. Currently, the price is testing the orange bullish trend line again and there is possibility for a bearish break. If this happens, the supports the price could meet are the blue level at 0.92001, which would also be the neck line of an eventual double top formation, and the already broken resistance at 0.90826. If the triangle gets broken in bullish direction, the first resistance to be met is the blue line at 0.94644, which indicates the previous top of the price. The momentum indicator is above the 100-level line and it is currently moving in bullish direction
Weekly technical analysis for 12 – 16.05
IMPORTANT ECONOMIC EVENTS DURING THE WEEK (GMT)
EURUSD:
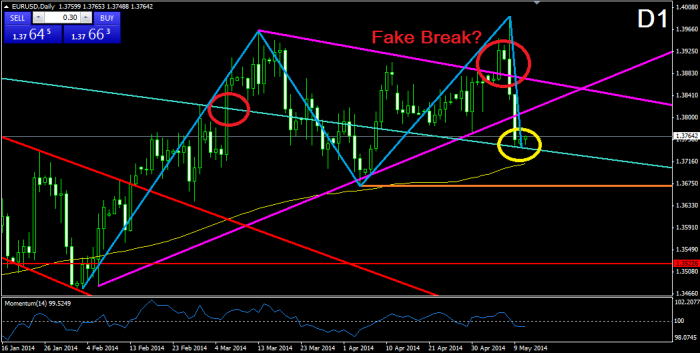
After breaking through the upper level of the purple triangle, the price did a big rapid drop to the already broken 6-year bearish trend line (turquoise). Currently, it looks like the price is being supported in this trend line, because something like a bounce is being formed. For this reason, we believe that if the price is going to increase, it would first meet the already broken sides of the triangle as resistances. If the price breaks through the turquoise bearish trend line, we would probably see an interaction with Simple Moving Average 150 and the orange support, which indicates the previous bottom of the price and the neck line of a head and shoulders formation (blue). If this happens, the first break through the upper level of the purple triangle would appear to be fake.
USDJPY:
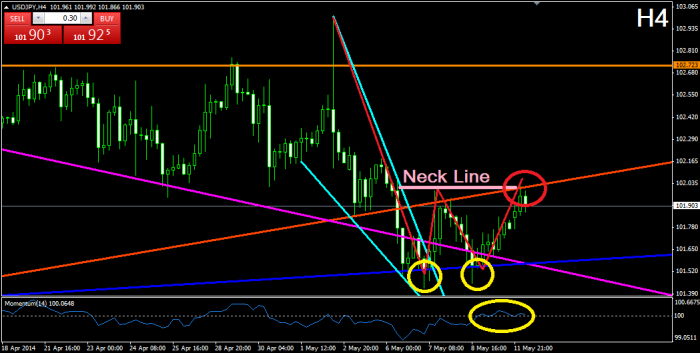
After breaking in a falling wedge formation through the orange bullish trend line from March 2013, the price found support in the blue bullish trend line from the beginning of February, it broke in bullish direction through the falling wedge formation and it formed a double bottom formation. The price bounced in bullish direction afterwards and the double bottom formation got confirmed. At the same time, the Momentum Indicator crossed the 100-level line in bullish direction. With the cross of the neck line, it looks like the price is testing the already broken orange bullish trend line as a resistance. Having in mind that the double bottom formation is already confirmed and supported by the signals of the momentum indicator, we assume that the price would probably break through the orange line again and would continue its bullish movement.
GBPUSD:
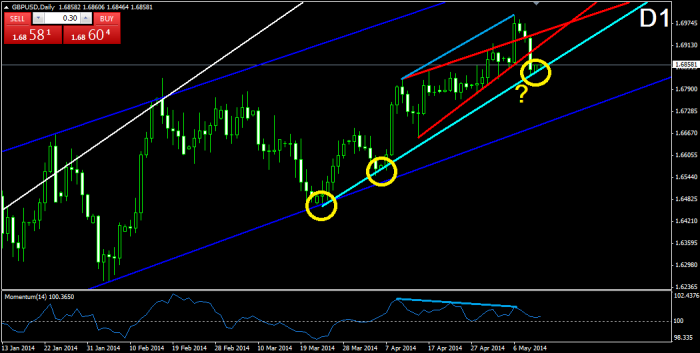
The Cable did a surprising bullish break through the upper level of the rising wedge formation, which created the impression that the price would probably directly meet the upper level of the blue bullish corridor from November 2013. Suddenly, the price decreased as a result of economic information and the turquoise bullish trend line was formed. As you see, there is a bearish divergence between the chart and the momentum indicator, which warned us for the bearish decrease in advance. Now it looks like the price is being supported by this line and we might see a bullish bounce. If the price increases, it would first meet the sides of the already broken rising wedge as resistances. If the price breaks through the turquoise bullish trend line, we would eventually see a decrease to the lower level of the blue bullish corridor.
USDCHF:
The price has just confirmed a double bottom formation on the D1 chart. After its last bounce from the turquoise bearish line, the price increased in bullish direction ad crossed the neck line of the formation. At the same time, the momentum indicator has crossed the 100-level line in bullish direction. For this reason, we expect an increase of the price at least to the green resistance, which indicates the previous top of the price, and which is also the neck line of another, bigger double bottom formation. If this neck line gets broken, we would be able to look for more bullish pips from this pair.
AUDUSD:
After correcting to the orange bullish trend line from the beginning of January, the price created a Doji candle (green circle) and broke through the upper level of the wedge, which the price was correcting in. At the same time, the momentum indicator also increased in bullish direction through the 100-level line. Currently, the price is still increasing in bullish direction and it is expected to increase at least to the green resistance, which indicates the previous top of the price around 0.94530. If this happens, we should be careful for a break or a bounce, which would determine the future movement of the price of the Aussie.
Weekly technical analysis for 5 – 9.05
IMPORTANT ECONOMIC EVENTS DURING THE WEEK (GMT) 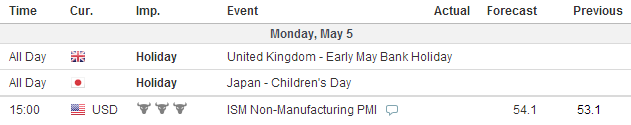
EURUSD:
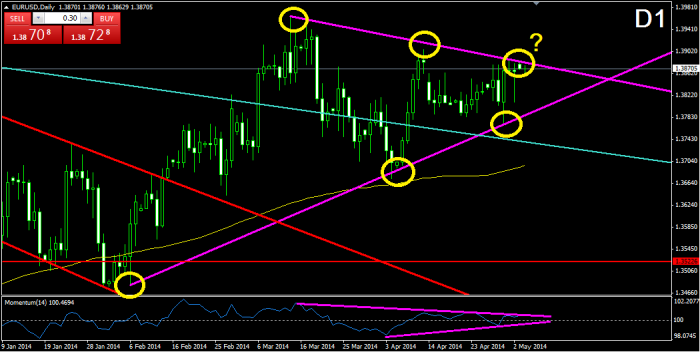
On the D1 chart we notice that the price is currently testing the upper level of the symmetrical triangle. The upper level is being tested for third time, while the lower level has been already tested for three times. As we all know, the symmetrical triangle has the potential to break in both directions. The Momentum Indicator has also formed a symmetrical triangle and it is currently above the 100-level line, where it is testing the upper level of the formation. The movement of the indicator is pretty similar to the movement of the price. For this reason, we could use the indicator as a trigger of a position. If there is a break in the indicator’s triangle, we could outrun the movement of the price.
USDJPY:
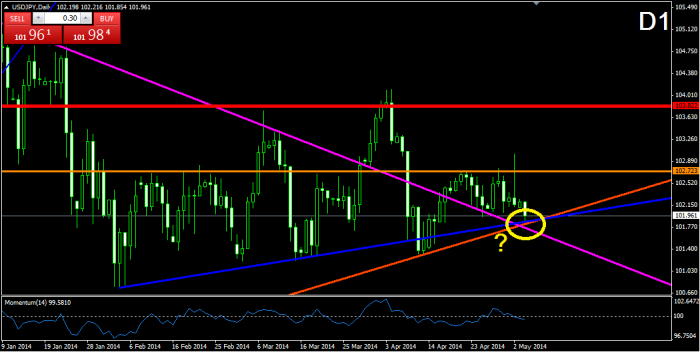
Currently, the price is testing three supports at once – the interaction point of the already broken purple bearish trend line from the end of December 2013, the orange bullish trend line from the end of March 2013, and the blue bullish trend line from the beginning of February 2014. For now it looks like the price is being supported, but that could not be said for sure yet. At the same time, with crossing the 100-level line in bearish direction, the Momentum Indicator demonstrates bearish activity. If the price bounces from the interaction point of the three supports, the next resistance to be met is the orange straight at 102.723. If it gets broken, we have the red resistance at 103.822.
GBPUSD:
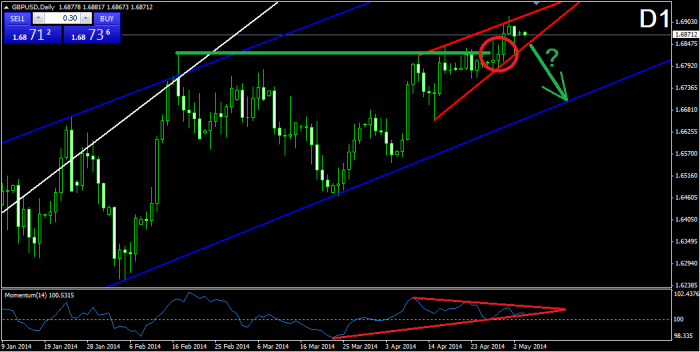
The price is still moving in the rising wedge formation from the beginning of April. Last, it bounced from the upper level of the formation and now the price is about to meet the lower level of the formation. At the same time, the formation is to its end and it is possible to see a break pretty soon. Also, there is a bearish divergence between the tops of the price’s chart and the Momentum Indicator, which supports the theory that the price might break through the lower level of the formation. If this happens, we might expect another meeting with the lower level of the blue bullish corridor from the beginning of November 2013.
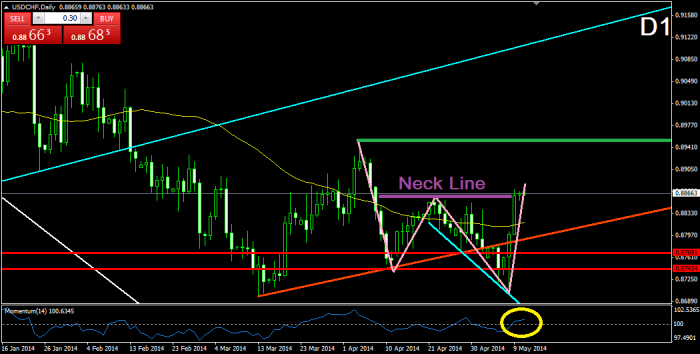
USDCHF:
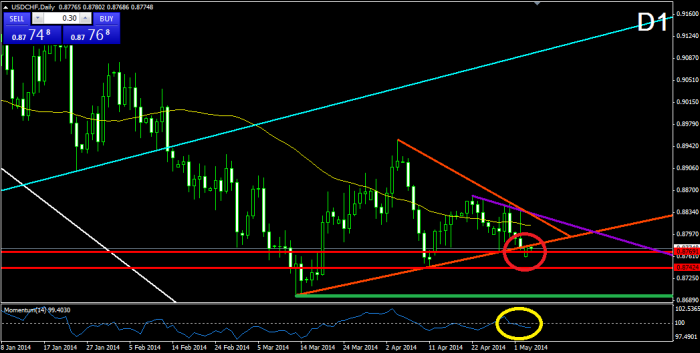
With the opening of the markets today, the price did a bearish break through the lower level of the symmetrical triangle on the D1 chart. It even broke through the 0.87691 support and now it is testing the already broken lower level of the triangle as a resistance. Having this in mind, we could expect the price to meet the next support at 0.87424 during the week. At the same time, the Momentum Indicator has also crossed the 100-level line in bearish direction, which is another sign that the bears would eventually overpower the bulls. If the price manages to break this support, the next level to be met is the 42-months low at 0.87000 (green).
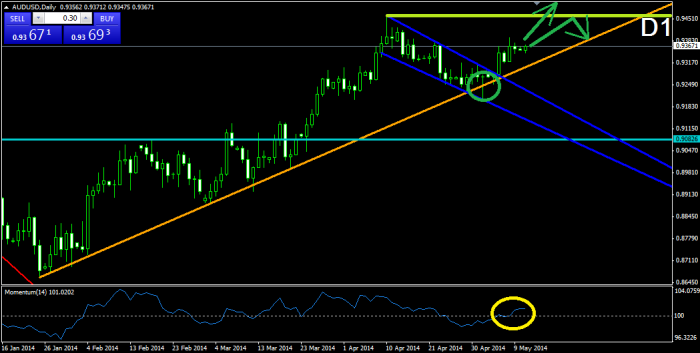
AUDUSD:
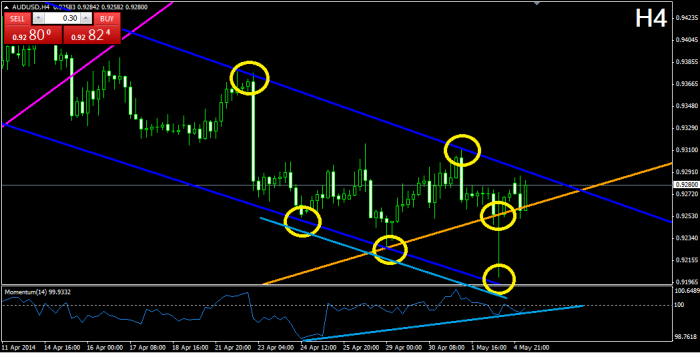
After the blue bearish corridor brought the price to the yellow bullish trend line from January 24, the price is crawling on the bullish line toward the upper level of the corridor. It is a matter of less than a day to see a reaction between the price and the two levels. We believe that the yellow bullish trend line would appear stronger than the corridor, because it is older and many-times tested. At the same time, we already see the support the line is able to cause on the price. Furthermore, the Momentum Indicator shows a bullish divergence between the price and itself. For this reason, we believe it is only a matter of time to see the price breaking through the upper level of the corridor.
