Weekly technical analysis for 7 – 11.04
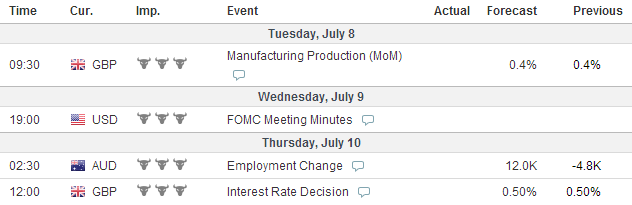
IMPORTANT ECONOMIC EVENTS DURING THE WEEK (GMT)
EURUSD:

After interacting with Simple Moving Average 150, the price was resisted and bounced through the green bullish trend line from June 12. The price decreased to the 61.8% Fibonacci Level afterwards, where it looks it is getting supported now. Furthermore, the consolidation around the 61.8% Fibonacci Level resembles a falling wedge formation (orange), which, as we all know, has bullish potential. For this reason, we believe that a bounce from the 61.8% Fibonacci level is about to appear. On the other hand, we get a contrary signal from the momentum indicator, which has just crossed the 100-level line in bearish direction, but at the same time, the cross is tiny and as we see, the indicator is changing direction and might cross the 100-level line back.
USDJPY:

After decreasing to the 101.307 support, the Yen did a bullish bounce and started moving in bullish direction, which was pretty much what the price was doing during the last week. Currently the price is consolidating, where the consolidation resembles a triangle. At the same time, the momentum indicator has crossed the 100-level line in bullish direction, which implies, that the price would eventually break the triangle in bullish direction. For this reason, we believe that the price is likely to increase to the 102.729 resistance, like it has been doing the last two times.
GBPUSD:

After breaking through its 5-years high, the price has increased with about 120 pips more and it started creating bearish candles, which speaks of an eventual change in the direction of the pair, or for an eventual correction. Furthermore, there is an obvious divergence between the tops and the bottoms of the chart and the momentum indicator, which supports our bearish thesis. For this reason, we believe that the price would eventually decrease to the lower level of the pink bullish corridor or even to the 1.70527 support or the lower level of the blue bullish corridor from the last year.
USDCHF:

After breaking in bearish direction through the green bullish corridor, the price decreased to 0.88550n where it found support and bounced in bullish direction. The price increased and it is currently meeting the already broken neck line of the big double bottom formation (W1) at 0.89520 as a resistance. The last three candles of the increase of the price resemble a rising wedge formation, which as we all know, has bearish potential. For this reason, we believe that the price would eventually drop. At the same time, the momentum indicator has done a tiny cross of the 100-level line, but its behavior during the last candle of the price shows that it might return back beyond the 100-level.
AUDUSD:

After breaking in bearish direction through the purple bullish trend line from May 29, the price decreased to the already broken green bearish line from April 10 and tested it as a support. The Aussie bounced in bullish direction, which speaks of an upcoming new bullish activity. On the other hand, the momentum indicator has crossed the 100-level line in bearish direction, which means that the bounce from the already broken green bearish trend line might appear to be only a correction of a further bearish movement. For this reason, it might be good here to wait for the momentum indicator to go above the 100-level line, or for the price to go beyond the green bearish line, so we would have a confirmation on one of the scenarios.

Leave a comment