Weekly technical analysis for 21 – 25.07
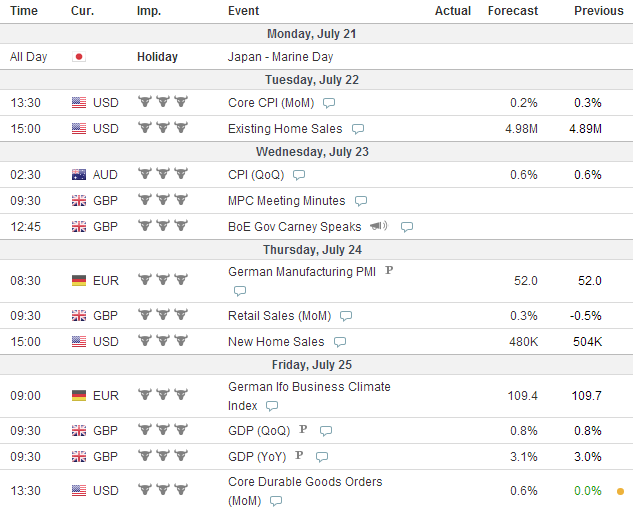
IMPORTANT ECONOMIC EVENTS DURING THE WEEK (GMT)
EURUSD:
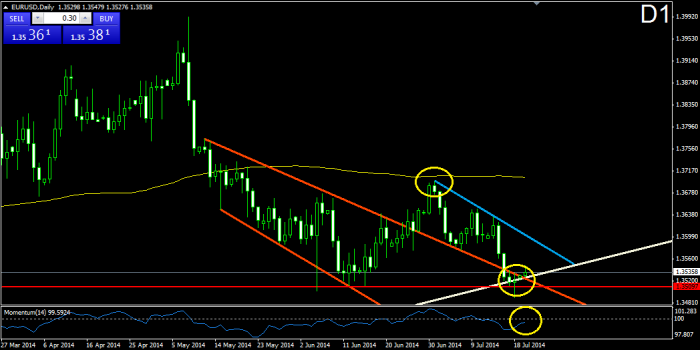
Currently, the price attempts a bullish bounce from three supports at once. The first one is the red horizontal level at 1.35097. The second one is the already broken upper level of the orange bearish corridor from May 12, and the third one is the white bullish line from July 2012. As we see, the supports, which the price experiences are pretty strong and this is the reason to believe that the bullish scenario is the more possible one. Furthermore, this is the third bottom on the white bullish line and currently it is July 2014. The other two bottoms are from July 2013 and July 2012, which creates the idea that the price starts an increase in every July. The momentum indicator is about to meet the 100-level line in bullish direction.
USDJPY:
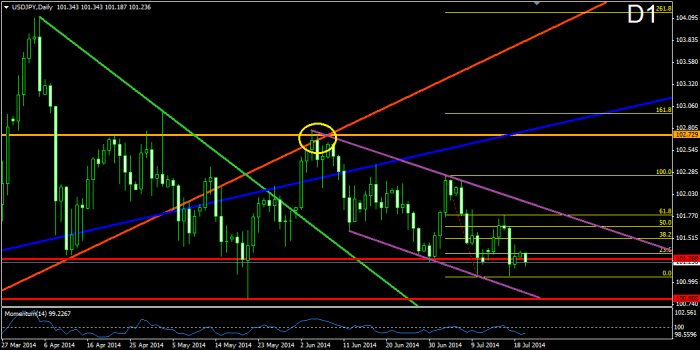
On its way down from its last interaction with the 102.729 resistance (yellow circle), it looks like the price is following a bearish corridor (purple). Finally, the corridor brought the price to test the support at 101.268 and it even looks like the price attempts to break this level. This would be clear after we see the price testing the lower level of the corridor again. Notice, that the momentum indicator follows exactly every swing of the price and currently it attempts to create a bottom and to start a bullish increase, which means that the 101.268 support might not get broken exactly this time.
GBPUSD:
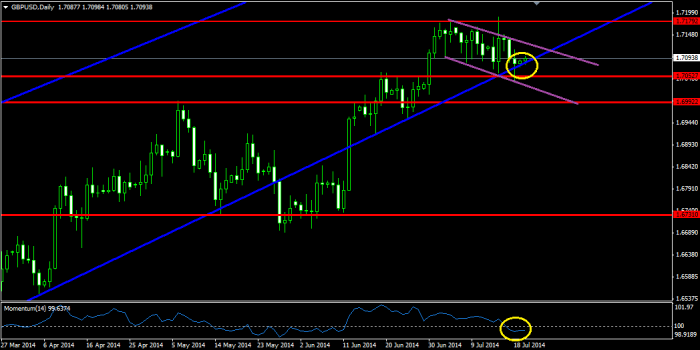
Having in mind that after reaching the level of 1.71792 the purple bearish corridor brought the price to test the lower level of the blue bearish corridor from September 2013 and even a bullish bounce appeared, we might expect the price to break the upper level of the purple corridor. If this happens, a new interaction with 1.71792 would be expected and, eventually, the creation of a new high. On the other hand, the momentum indicator did a clear bearish break through the 100-level line, which speaks of the opposite scenario. If a break in the lower level of the blue bullish corridor occurs, we might see the price testing 1.70527 or even 1.69922.
USDCHF:
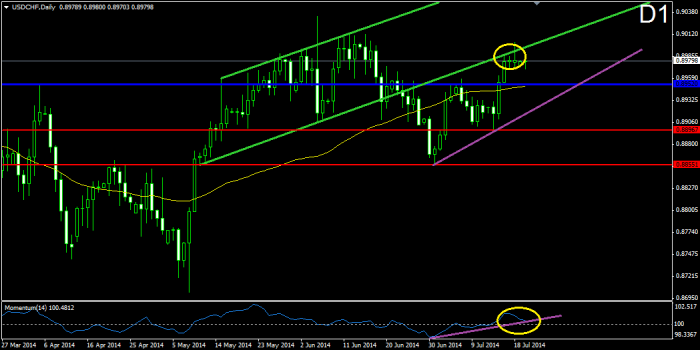
As you see, the price of the Swissy tests the already broken lower level of the green bullish corridor as a resistance and having in mind the last 4 candles on the chart, we could state that the price is really having a hard time breaking through this level. At the same time, the momentum indicator switched above the 100-level line and currently it is testing its bullish line. This situation gives us two controversial signals – a bearish bounce from the green line, or a bullish bounce for the momentum. If the momentum bounces in bullish direction, a break in the green line on the chart might occur. If the momentum breaks in bearish direction, we would probably see the price bouncing from the green line and reaching the purple bullish line on the chart, which connects the last two bottoms of the price.
AUDUSD:
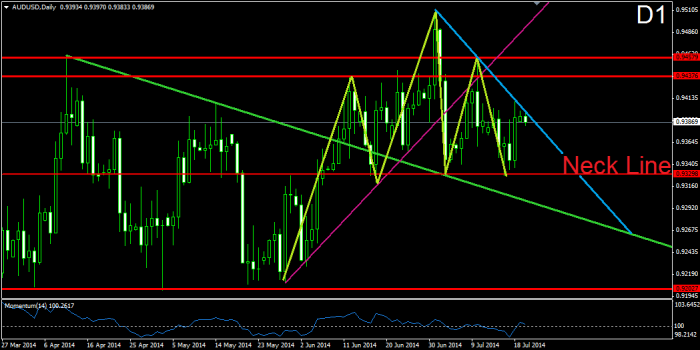
The price is currently testing its blue bearish line, which connects the last two tops of the price. For now it looks like the price is going to bounce from the blue line and would meet the neck line of its head and shoulders formation (green-yellow). If a break in the neck line appears, we might see one continuous drop of the price in the next few weeks, which could even reach the support at 0.92927. If a break in the blue bearish line occurs, we might see the price testing the blue bearish line as a support, and increasing to 0.94376 or even to 0.94579.

Leave a comment