Weekly technical analysis for 28.07 – 1.08
IMPORTANT ECONOMIC EVENTS DURING THE WEEK (GMT)
EURUSD:
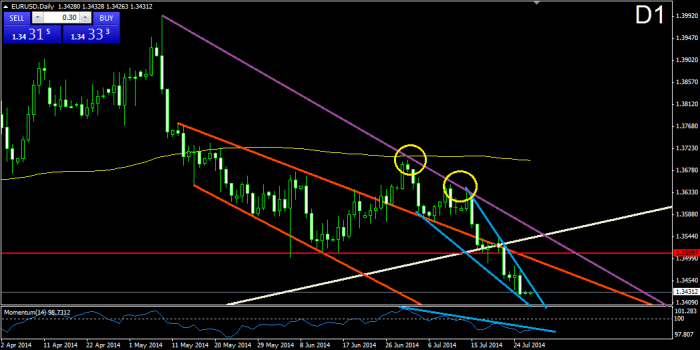
The recent bearish movement of the price after the interaction with the purple bearish trend line resembles a falling wedge formation. As we all know, the falling wedge formation has the potential to break in bullish direction and to increase the price as much as the size of the formation is. At the same time, the momentum indicator has also been decreasing and it is about to reach its lowest possible point. If this happens, we could expect the indicator (and eventually the price) to make a bullish correction, which would satisfy the falling wedge formation. For this reason, we believe the price would probably return again to the purple bearish trend line for a test. The decrease of the momentum has been following a bearish trend line (blue). A bullish break in the wedge, or in the blue bearish trend of the momentum, could be considered as a signal for a long position.
USDJPY:
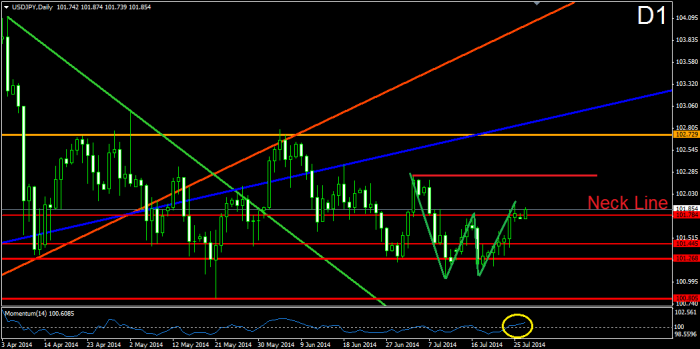
As you see, the price has confirmed the green double bottom formation with interrupting its neck line at 101.784. At the same time, the momentum indicator has crossed the 100-level line in bullish direction, which supports the continuation of the bullish movement caused by the double bottom formation. For this reason, we believe that the price would increase at least to the resistance, which indicates the beginning of the double bottom formation or even to the many times tested orange 102.729 resistance. After all, the bullish increase is expected to be about 76 bullish pips.
GBPUSD:
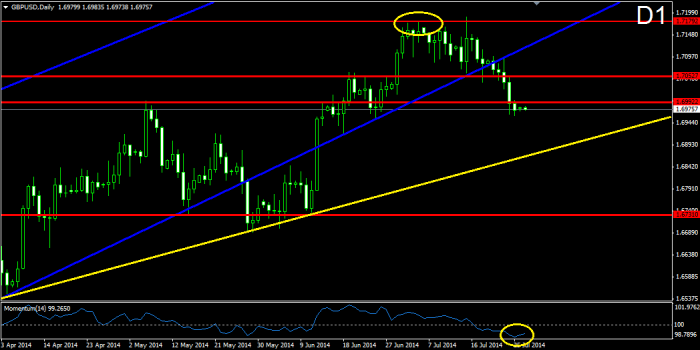
After reaching its 70-months high at 1.71792, the price started a bearish decrease, which broke through the lower level of the blue bullish corridor from September 2013, the 1.70527 support and the 1.69922 support. Currently, it looks like the decrease of the price is slowing down its intensity. At the same time, the momentum indicator has reached its lowest possible level, which speaks of an eventual correction. As you see, we have drawn a line, which connects the last two big bottoms of the price and we could use it as a support in case of an eventual meeting of the price with it. But having in mind the recent behavior of the momentum indicator and the Cable in general, this might happen after the price does some kind of correction first.
USDCHF:
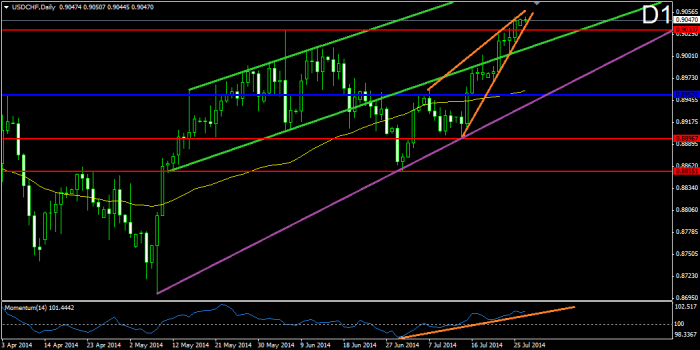
As we have said for many times, the situation by the Swissy is a mirror image to the EUR/USD currency pair. Again, after the last interaction with the purple bullish trend line, the price started increasing in a rising wedge formation. As we all know, the rising wedge formation has the potential to break in bearish direction and to decrease the price as much as its size. At the same time, the momentum indicator has been moving after a bullish trend line and it has almost reached its highest point. After this happens, we could expect the indicator (and eventually the price) to do a bearish correction, which would satisfy the rising wedge formation. A signal for an upcoming bearish movement could be a bearish break in the wedge, or a bearish break in the orange bullish trend line of the momentum indicator.
AUDUSD:
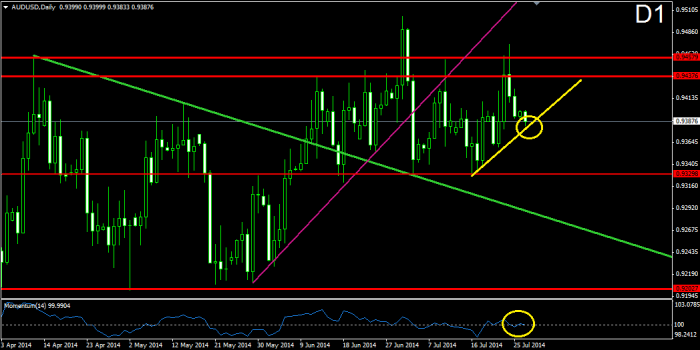
During the last week the price returned to the yellow bullish trend line from July 16. Currently, the price is testing the yellow bullish trend line as a support. At the same time, the momentum indicator is testing the 100-level line as a support. For this reason, it looks like the price is likely to bounce from the yellow bullish trend line and the momentum indicator to bounce from the 100-level line. The price is likely to reach the resistances at 0.94376 and 0.94579 afterwards. If the price breaks these resistances, we might witness the creation of a new price high.

Leave a comment