Weekly technical analysis for 19 – 23.05
IMPORTANT ECONOMIC EVENTS DURING THE WEEK (GMT)
EURUSD:
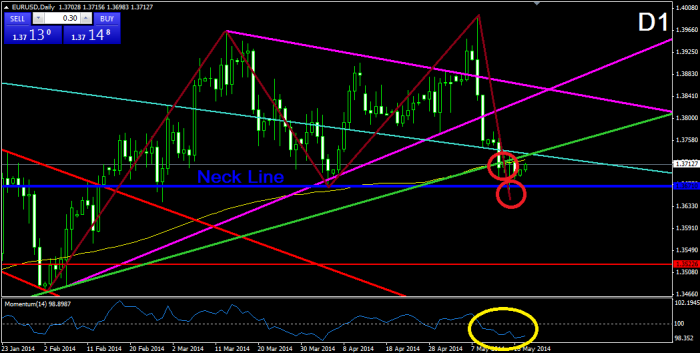
After getting out of the purple triangle, the price did a rapid decrease, which created a double top formation and the price broke the Simple Moving Average 150, the green 2-years bullish trend line and the 1.36710 neck line of the double top formation on a later stage. This has confirmed the double top formation and now we have a sufficient reason to believe that the price might drop to 1.34660. At the same time, the momentum indicator is getting exhausted in its bearish movement, which could mean that a bullish correction is about to appear before the expected bearish movement.
USDJPY:
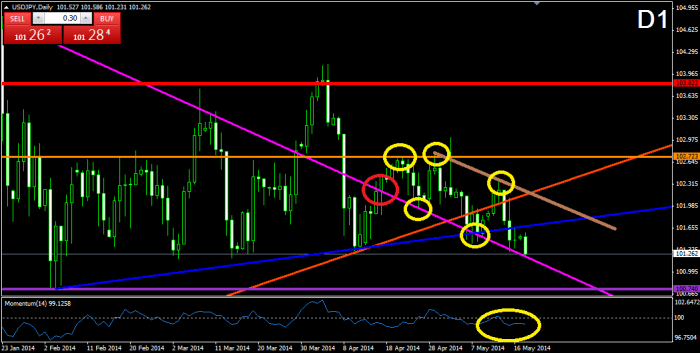
After decreasing to the interaction point of the already broken purple bearish trend line from the end of December 2013 (W1) and the blue bullish trend line from the beginning of February, the price did a correction to the orange bullish trend line from March 2013, and a new bearish decrease, which broke the blue bullish trend line and met the price with the already broken purple bearish trend line again, where the price is being supported now. For this reason, we believe that the price is about to do a bullish correction again. A possible resistance for the target of the correction would be the brown bearish trend line, which connects the last two tops of the price and is parallel to the already broken purple bearish trend line.
GBPUSD:
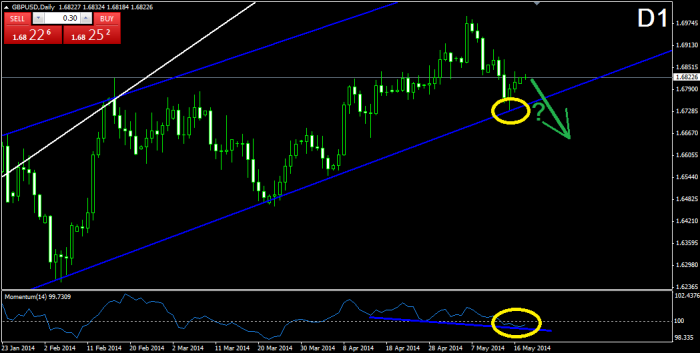
During its last increase, the cable did not manage to meet the upper level of the blue bullish corridor it has been following in the last six months. The price even dropped and met the lower level of the corridor, which signalizes for a decrease in the intensity of the general bullish activity. At the same time, the last bottoms of the price are in a bearish divergence with the bottoms of the momentum indicator. Furthermore, the momentum indicator has also crossed the 100-level line in bearish direction, which supports the bearish idea. Anyway, remind that the lower level of the bullish corridor is an old and strong level, which would be hard to be broken.
USDCHF:
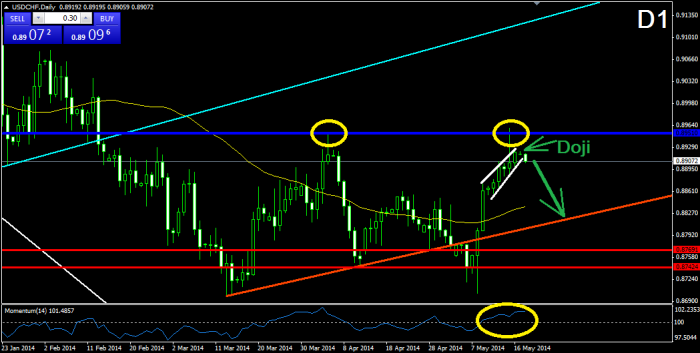
As we see, the price did a bullish increase to the 0.89510 resistance in a rising wedge formation, where it did a bearish bounce and the rising wedge formation got broken in bearish direction. Another bearish signal is the Doji candlestick which was formed before the current bearish candle. As we all know, the Doji candle means that the bullish and the bearish forces are equalized and a change in the trend might occur. Furthermore, the momentum indicator is in its top positions and it would soon start dropping too. For this reason, we believe that the price would decrease at least to Simple Moving Average 50. The next possible supports are the orange bullish trend line from the middle of March, the red supports at 0.87691 and 0.87424.
AUDUSD:
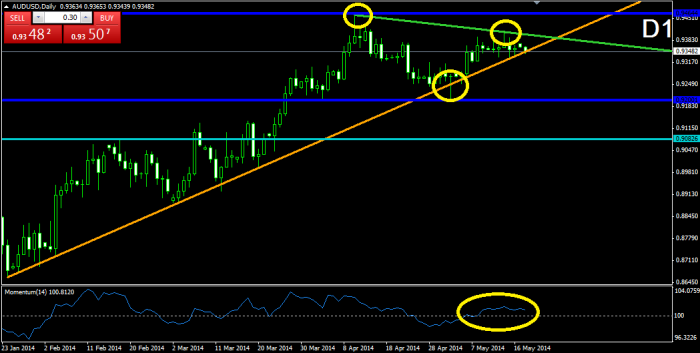
After bouncing from the orange bullish trend line from January, the price increased and formed a top, which is lower than the previous and which forms a bearish line (green). This green bearish line and the orange bullish trend form a triangle, which is about to get broken at any time. Currently, the price is testing the orange bullish trend line again and there is possibility for a bearish break. If this happens, the supports the price could meet are the blue level at 0.92001, which would also be the neck line of an eventual double top formation, and the already broken resistance at 0.90826. If the triangle gets broken in bullish direction, the first resistance to be met is the blue line at 0.94644, which indicates the previous top of the price. The momentum indicator is above the 100-level line and it is currently moving in bullish direction

Leave a comment