Weekly technical analysis for 5 – 9.05
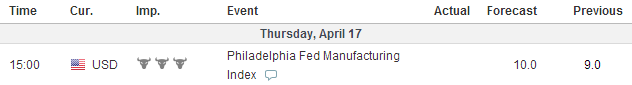
IMPORTANT ECONOMIC EVENTS DURING THE WEEK (GMT) 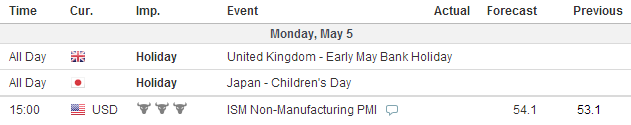
EURUSD:
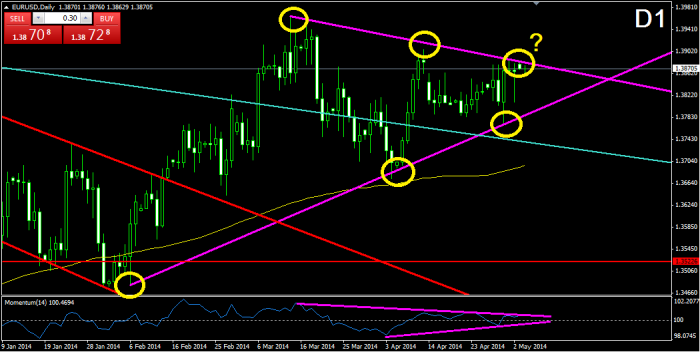
On the D1 chart we notice that the price is currently testing the upper level of the symmetrical triangle. The upper level is being tested for third time, while the lower level has been already tested for three times. As we all know, the symmetrical triangle has the potential to break in both directions. The Momentum Indicator has also formed a symmetrical triangle and it is currently above the 100-level line, where it is testing the upper level of the formation. The movement of the indicator is pretty similar to the movement of the price. For this reason, we could use the indicator as a trigger of a position. If there is a break in the indicator’s triangle, we could outrun the movement of the price.
USDJPY:
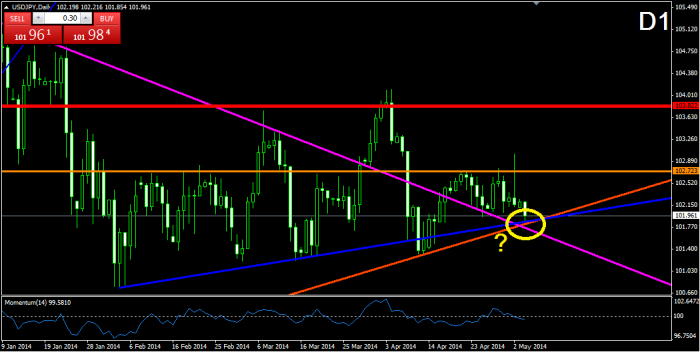
Currently, the price is testing three supports at once – the interaction point of the already broken purple bearish trend line from the end of December 2013, the orange bullish trend line from the end of March 2013, and the blue bullish trend line from the beginning of February 2014. For now it looks like the price is being supported, but that could not be said for sure yet. At the same time, with crossing the 100-level line in bearish direction, the Momentum Indicator demonstrates bearish activity. If the price bounces from the interaction point of the three supports, the next resistance to be met is the orange straight at 102.723. If it gets broken, we have the red resistance at 103.822.
GBPUSD:
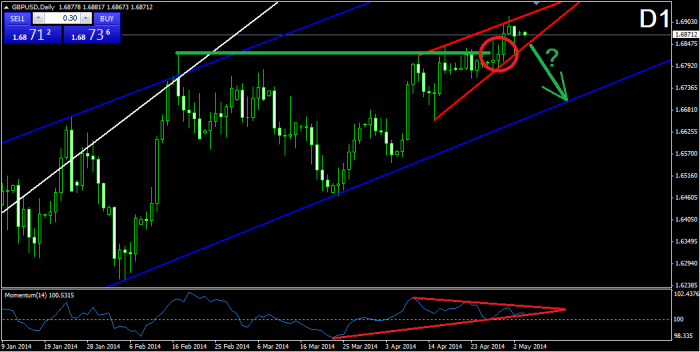
The price is still moving in the rising wedge formation from the beginning of April. Last, it bounced from the upper level of the formation and now the price is about to meet the lower level of the formation. At the same time, the formation is to its end and it is possible to see a break pretty soon. Also, there is a bearish divergence between the tops of the price’s chart and the Momentum Indicator, which supports the theory that the price might break through the lower level of the formation. If this happens, we might expect another meeting with the lower level of the blue bullish corridor from the beginning of November 2013.
USDCHF:
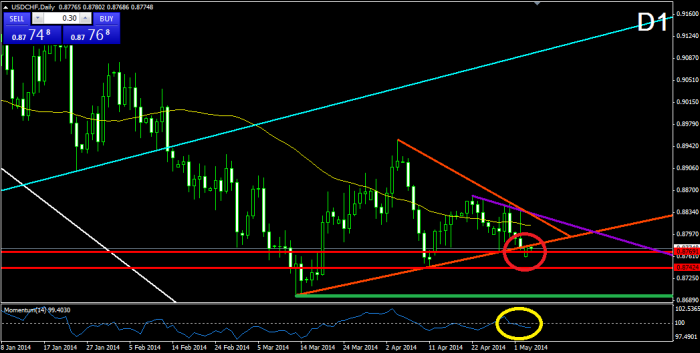
With the opening of the markets today, the price did a bearish break through the lower level of the symmetrical triangle on the D1 chart. It even broke through the 0.87691 support and now it is testing the already broken lower level of the triangle as a resistance. Having this in mind, we could expect the price to meet the next support at 0.87424 during the week. At the same time, the Momentum Indicator has also crossed the 100-level line in bearish direction, which is another sign that the bears would eventually overpower the bulls. If the price manages to break this support, the next level to be met is the 42-months low at 0.87000 (green).
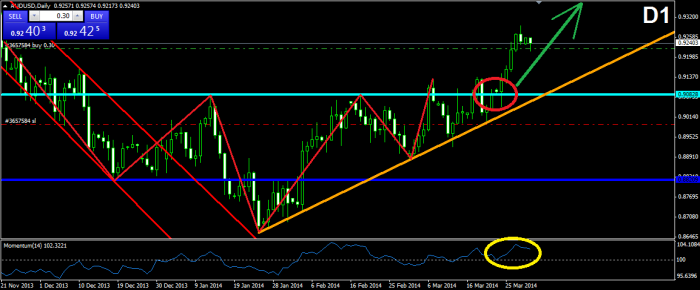
AUDUSD:
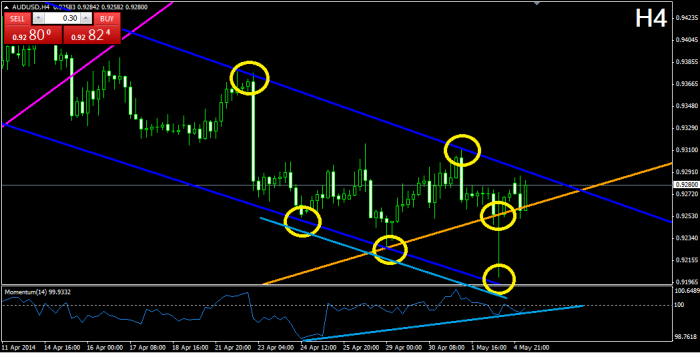
After the blue bearish corridor brought the price to the yellow bullish trend line from January 24, the price is crawling on the bullish line toward the upper level of the corridor. It is a matter of less than a day to see a reaction between the price and the two levels. We believe that the yellow bullish trend line would appear stronger than the corridor, because it is older and many-times tested. At the same time, we already see the support the line is able to cause on the price. Furthermore, the Momentum Indicator shows a bullish divergence between the price and itself. For this reason, we believe it is only a matter of time to see the price breaking through the upper level of the corridor.
Weekly technical analysis for 28.04 – 2.05
IMPORTANT ECONOMIC EVENTS DURING THE WEEK (GMT) 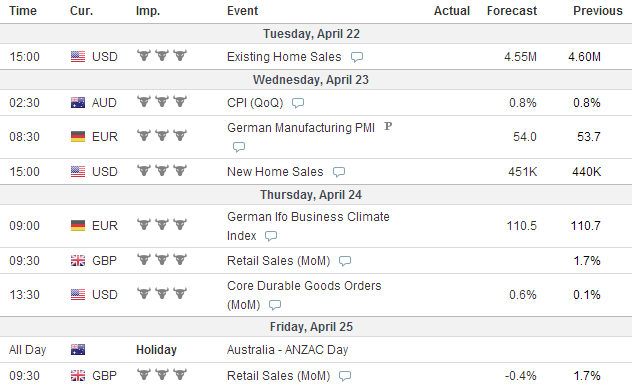
EURUSD:
The price is still moving in the horizontal corridor. The support matches with the 50.0% Fibonacci Level, while the resistance lays on the 23.6% Level. The support has been tested for three times, and the resistance for four times. Currently, the price is moving in bearish direction after a bounce from the upper level of the corridor. This hints that the price would most likely interact with the lower level of the corridor. When this happen there are two options – support or a break. If the price breaks through the lower level of the corridor, the next support it would meet is the 61.8% Fibonacci Level and the already broken 5-years bearish trend line (turquoise). If the price bounces from the lower level of the corridor, then we will probably witness another interaction with the upper level of the corridor. The Momentum Indicator is right on the 100-level line and it is about to cross it in bearish direction.
USDJPY:

After the break through the purple bearish trend line, the price has been resisted by the 102.725 level. The followed bearish drop decreased the price to the already broken purple bearish trend line, where the price tested it as a support. This is one of the indications for an upcoming bullish movement. At the same time, the Momentum Indicator has done a certain cross of the 100-level line in bullish direction. Furthermore, the resistances, which eventually could stop the price have been already broken. For this reason, we believe that the price would eventually increase at least to the thick red resistance, which actually has also been previously broken.
GBPUSD:
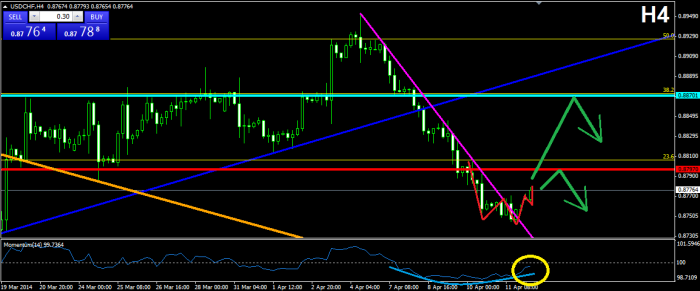
The rising wedge formation on the H4 chart is obvious. The upper level of the formation has been tested for three times, while the lower has been tested for four times, where the last one was few hours ago. Having in mind that the formation has bearish potential and the price demonstrates a bullish activity currently, we might see another interaction with the upper level of the wedge, before any break. At the same time, the Momentum Indicator has crossed the 100-level line in bullish direction, which supports the bullish theory. After the price interacts with the upper level of the formation, the more possible scenario would be a resistance in the upper level of the formation and a bounce through the lower level. Furthermore, the price might get attracted bu the blue bullish trend line, which is actually the lower level of the corridor on D1.
USDCHF:
 After breaking in bearish direction through the rising wedge formation (blue), the price dropped with the size of the formation itself, which considers the potential movement as completed. The bearish movement after the break could be followed by the pink bearish trend line on the graph. As you see the line has been recently broken in bullish direction by the price. At the same time, the Momentum Indicator is about to cross the 100-level line in bullish direction, which gives additional support to the bulls. Furthermore, if the bullish movement continues, there is a potential for the confirmation of double bottom formation, which could send the price even further.
AUDUSD:

After the bearish break through the 1-month bullish trend line (purple), the price dropped to the 3-month bullish trend line (orange), where it started consolidating and tested the level. The consolidation has the shape of an inverted head and shoulders formation, where the green straight is the neck line. As we see, the neck line has been interrupted, which has confirmed the formation. Furthermore, the Momentum Indicator is on the 100-level line and it is about to cross it in bullish direction. Having in mind the stability of the orange bullish trend line, the confirmed inverted head and shoulders formation and the momentum indicator, which is about to give a clear bullish signal, we might state that the bulls would probably dominate during the current trading week.
Weekly technical analysis for 21 – 25.04
IMPORTANT ECONOMIC EVENTS (GMT)

EURUSD:

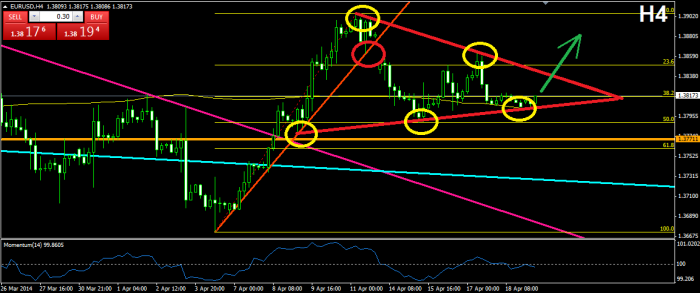
After the price broke through the orange bullish trend line, it did a drop to the 50.0% Fibonacci Level, which was the first movement of the current consolidation of the price. Now, we are able to connect the tops and the bottoms of the chart and to create a bullish pennant. The upper level of the formation has been tested for two times, while the price is now testing the lower level for third time and it looks like the bullish bounce is already a fact. As we all know, the bullish pennant has bullish potential and the price is likely to break through the upper level of the formation. For this reason, we believe that after the current bullish bounce from the lower level of the formation, the price might directly break in bullish direction. The Momentum Indicator is under but very close to the 100-level line, so if there is going to be a break through the upper level of the formation, we might first see it with the Momentum Indicator.
USDJPY:
After the price has been following the inverted Head and Shoulders formation for the past week, it now looks like the formation’s potential is fully completed. Anyway, that does not mean that the price has ended with the bullish movement. Currently, the price is testing the orange resistance, which points some of the important tops and bottoms by this pair. We would like to remind that the orange resistance has been broken already, which is a proof that the price has the capability to deal with it. Furthermore, there are no indications that the price might change direction. The Momentum Indicator is still moving in bullish direction and it has just tested the 100-level line and the blue bullish trend line as supports and the level managed to handle the pressure of the indicator. For this reason, we believe that the bullish activity would most likely continue.
GBPUSD:

After the bullish bounce from the lower level of the blue bullish corridor (D1) the price started a bullish increase, which resembles an ascending triangle. Currently, the triangle is to its end and soon we should expect a break through the upper or the lower level soon. The signals on the chart are a bit controversial: the price has interrupted the turquoise resistance, which hints for an upcoming bullish activity, but on the other hand, there is a small bearish divergence between the chart and the Momentum Indicator, which supports the bears. For this reason, the best move here might be to wait for a while in order to see where the price is going to develop to.
USDCHF:
As you see, after the bullish break through the purple bearish trend line, the price started increasing in a Rising Wedge formation, which as we all know, has bearish potential. The last two tests of the lower level of the formation, has interrupted the lower line, which gives additional strength to the potential bearish scenario. Furthermore, the Momentum Indicator is very close to the 100-level line and every bearish break of the 100-level line could be used as a trigger of a short position. As you see, the red resistance at 0.87970 has been already broken, which shows that the price might not have big troubles with it.
AUDUSD:
The situation by this pair is pretty similar to the USDCHF pair. The price was following the purple bullish trend line until it did a bearish break and interrupted the line. Then the price started moving in a Falling Wedge formation, which hints that the current bearish movement of the price might be a correction of the purple bullish trend. For this reason, a long position could be opened now, or when the price break through the upper level of the Rising Wedge formation. Another trigger of a long position could be the Momentum Indicator, if it crosses the 100-level line in bullish direction.
IMPORTANT ECONOMIC EVENTS (GMT)
EURUSD:

After bouncing from the 50.0% Fibonacci Level, the price started moving in bullish direction in a bullish corridor (pink). In a while, the price broke through the lower level of the corridor and then it returned to test the lower level of the bullish corridor as a resistance. The level resisted the price twice. For this reason, we believe that the expected outcome now is possible to be a decrease in the price of the pair. The orange line around 1.38000 indicates the first bottom of the price, which is outside the bullish corridor. Therefore, the price should break this level in order to confirm hard intentions for a further bearish movement.
USDJPY:

After reaching the red bullish trend line (W1), the price started consolidating and an inverted Head and Shoulders formation was created. Yesterday, even the Neck Line of the formation was crossed, which confirmed the formation and the expected outcome could be pursued now. The Neck Line of the formation and the blue bullish trend line on the Momentum Indicator create a bullish divergence, which looks like the bullish movement is already happening.For this reason, we believe that the price would keep following the inverted Head and Shoulders formation and the bullish rise would continue.
GBPUSD:

The price finally did a break – through the upper level (pink resistance) of the ascending triangle. The bullish break happened right after the creation of a small bullish pennant, which broke through its upper level and pushed the price in bullish direction. The followed bullish jump broke through the pink resistance. The overall Momentum Indicator’s movement is bullish and currently, the Momentum line is above the 100-level line, which is another bullish signal. Therefore, we believe that the price might be finally moving on and would create a new bullish movement.
USDCHF:

After breaking through the 1-week bearish trend (purple), the price changed its direction and started moving in a bullish corridor, where the lower level has been tested for three times and the upper level – for three times too. Currently, the price is in a position after a small bounce from the lower level of the corridor. We would like to mention that during the third test of the lower level of the corridor, at the same time the price tested the red support which indicates important tops and bottoms on the D1 chart. For this reason, we believe that the price would probably form a new bullish movement, which might send the price to the upper level of the corridor again.
AUDUSD:

As we already mentioned yesterday, the price broke through the 1-month bullish trend line (pink) and through the Neck Line of the Double Top formation on H4, which confirmed the formation. After the break of the trend, the price returned to the trend line in order to test it as a resistance and for now it looks like the level would stand the pressure of the price. At the same time, the bearish signals, which are given by the Momentum Indicator, are pretty obvious. For this reason, we believe that the inverted Head and Shoulders on the D1 chart has been already completed and the long positions might appear to be good to be closed. At the same time, the current situation looks like a pleasant opportunity to go short at least until the Double Top formation is completed.
Weekly technical analysis for 14 – 18.04
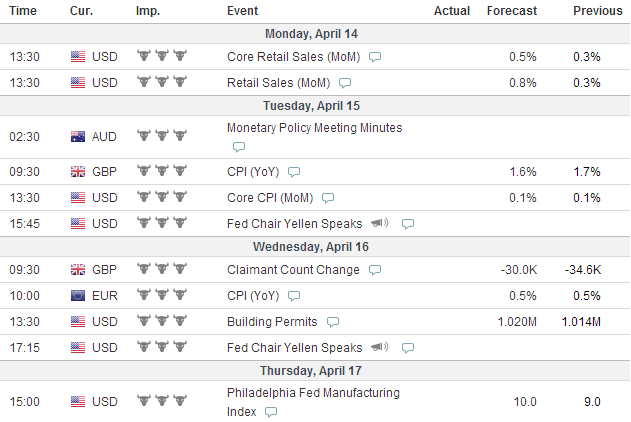
IMPORTANT ECONOMIC EVENTS DURING THE WEEK (GMT)
EURUSD:
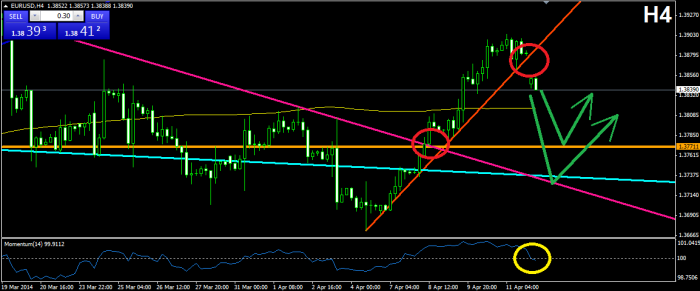
After breaking through the purple bearish trend line, the price started bullish increase, following another bullish trend line (orange). With the opening of the markets this morning, the price opened with a gap of 36 bearish pips, which broke the orange bullish trend line. Meanwhile, the Momentum Indicator was also doing a bearish decrease, where the line has just crossed the 100-level in bearish direction. Since the price broke in bullish direction through the purple bearish trend line during the last week, the general movement of the price is expected to be bullish. For this reason, we believe that currently, the price might be doing a correction, which might stop in some of the potential supports of the price.
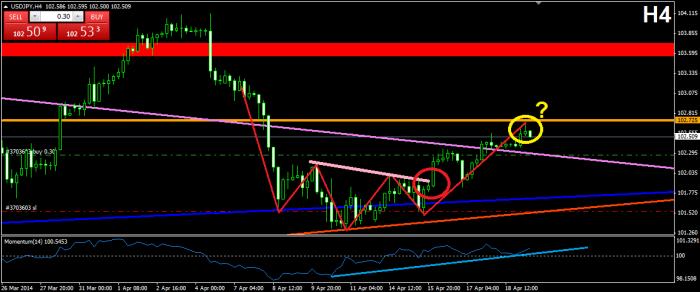
USDJPY:
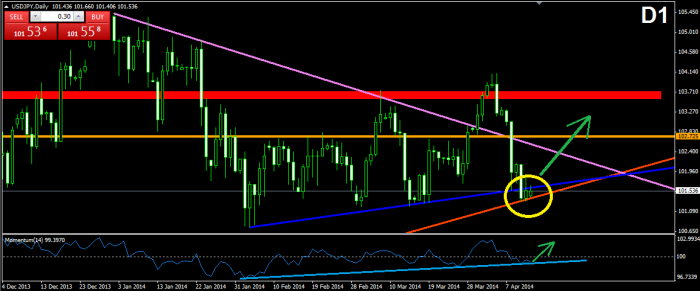
As we see, the price broke through the blue support line, which connects the last few bottoms of the price. Right after the break, the price started consolidating. If you switch to a W1 chart, you will see the reason for the consolidation. There is another support on W1 (bullish trend), which is a result of the bottoms the price has formed (orange) and this is where the price is consolidating now. In other words, the price is testing the orange level. Having in mind that the price is testing the orange level for sixth time, we believe that the level will probably support the price and we will witness another bounce from the orange line. At the same time, we see that the Momentum Indicator has also formed a bullish trend line (blue) and it is testing it now. We might use the indicator as a trigger of an eventual position.
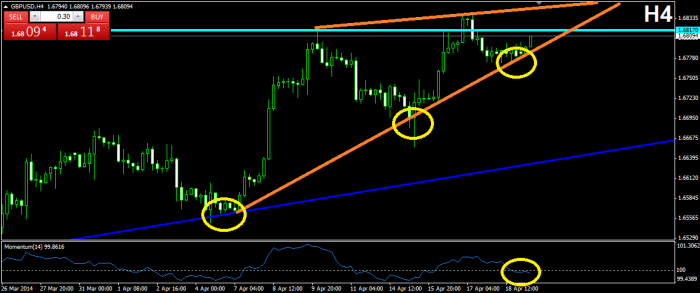
GBPUSD:
On the D1 chart we notice that after the third bounce from the pink bullish trend line (and also the blue bullish trend line), the price increased and was resisted by the 1.68170 level (turquoise), which marks the previous top of the price. A bearish bounce occurred afterwards. As you see, the turquoise resistance and the pink bullish trend line form an Ascending Triangle, which as we all know, has the potential to break in both directions. For this reason, it might be good to follow the scenario of the Ascending triangle, until we see a break in bearish or bullish direction, where we would be able to go short or long respectfully.
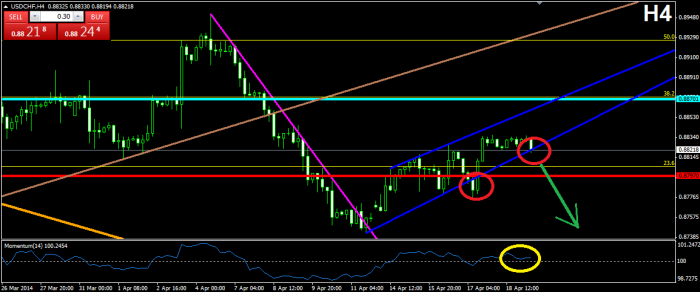
USDCHF:
After dropping with the pink bearish trend line, the price did a bullish break through the trend line, where after consolidating for a while, it formed something like a small inverted Head and Shoulders formation. At the same time, the Momentum Indicator was visibly slowing down and changing its direction, which could be followed by a rounded line (blue). Now the Momentum Indicator is about to cross the 100-level line in bullish direction. For this reason, we believe that the price would start moving after the inverted Head and Shoulders formation, where the first resistance it would meet is the red line at 0.87970 and if the price breaks, we have another – the turquoise line at 0.88701.
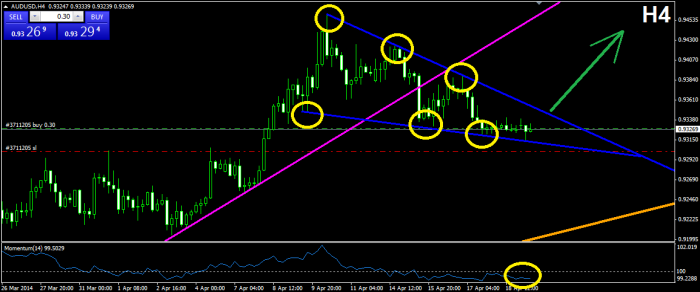
AUDUSD:
The price is still following the blue bullish trend line and the inverted Head and Shoulders formation respectfully. The price has around 100 more bullish pips to take from its current position in order to fully complete the formation. Currently the price is trying to reach the blue bullish trend line, where a bullish bounce is likely to occur. At the same time, the Momentum Indicator is following a bullish trend line too and the indicator is currently testing the line. We would like to remind that the Momentum Indicator could be used as a position trigger if a bounce or a break in the trend line on the Momentum Indicator occur.
Technical Analysis – 10/04/2014
IMPORTANT ECONOMIC EVENTS (GMT)
EURUSD:

The price started following a bullish trend line (red), which brought the price out of the frames of the purple bearish trend line and has been tested more than 6 times for now. Currently, it looks like the price is returning to the red bullish trend line for a test after the last increase. In other words, the price is doing a correcction. Since we have 6 bounces from the red bullish trend line it is more likely for the price to bounce again from the red bullish trend line. If a break occurrs eventually, there are three more lines, where the price could get supported. After all, the price might return to the already broken trend line for a test, which is a classic sign of a change in the trend.
USDJPY:

After its return to the blue support, which could be better seen on the D1 chart, the price increased in bullish direction and then it returned back to the blue support for a second test. For now, it looks like the support stands the pressure of the price. If a bullish bounce occurrs, there is a potential for a Double Bottom formation, which could gives additional confidence to the bullish attitude. Furthermore, the price and the momentum Indicator did a bullish divergence, while creating the first bottom. The divergence has not yet caused any bullish pressure on the price. At the same time, the Momentum Indicator did a slight cross of the 100-level line in bearish direction, which does not seem to be a trouble for now. It still might be a good time for a long position with a tight stop loss order – right under the blue support.
GBPUSD:

After bouncing from the lower level of the blue bullish corridor (better seen on D1), the price started increasing constantly under the orange bullish trend line you see on the graph. As you see, the line has been tested for three times and now the price is going to interact with it for a fourth time. Most likely, the price is going to bounce from the orange bullish trend line and it is going to start a new increase. But in this case, there is a bearish divergence between the Momentum Indicator and the chart of the price, which could make the price break through the orange bullish trend line. Anyway, if this happens, the price would probably meet the lower level of the blue bullish corridor again.
USDCHF:

The price is still moving under the red bearish trend line, which was created as a result of the bearish bounce from 50.0% Fibonacci Retracement. The red bearish trend line is now meeting the price with the red support, which indicates important previous tops and bottoms of the price. It could not be said if the price is going to break or not the level and for this reason, it is to early to speak about the future movement of the price. It would be good to wait for a while and to see how the price is going to deal with the level, which would probably help us open a positinon later.
AUDUSD:

The price still keeps moving in bullish direction and the bullish tendency gets more steep. For this reason, every previous trend line, which indicates previous and slower movement of the pirce, could be used as a support during an eventual break. The price is now following the smaller red trend line, which is a lot steeper than the orange and the blue bullish trend lines, but in case of an eventual break in the red bullish trend line, the price could find support in the orange and the blue bullish trend lines. The Momentum Indicator also supports the bullish movement for now.
Weekly technical analysis for 7 – 11.04
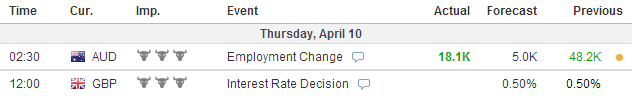
IMPORTANT ECONOMIC EVENTS (GMT)
EURUSD:
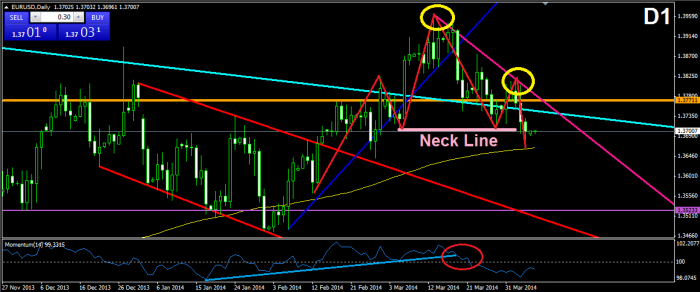
After the price confirmed the inclined Head and Shoulders formation from the last week, the price dropped more and it even confirmed a regular Head and Shoulders formation, which you see on the chart. The head and the second shoulder form a bearish line (purple) which could be used for determining the resistance levels of the price during the eventual bearish drop. After its last interaction with the purple line, the price dropped t SMA 150, where it looks like it finds support. Having in mind that the price did a regular size drop, and it interacted with SMA 150, a return to the purple bearish line could be expected. The drop of the price after reaching the top of the head could be clearly seen on the Momentum Indicator too. The Momentum Indicator broke through its trend line and the 100-level line, which set the beginning of a new bearish activity for the indicator.
USDJPY:
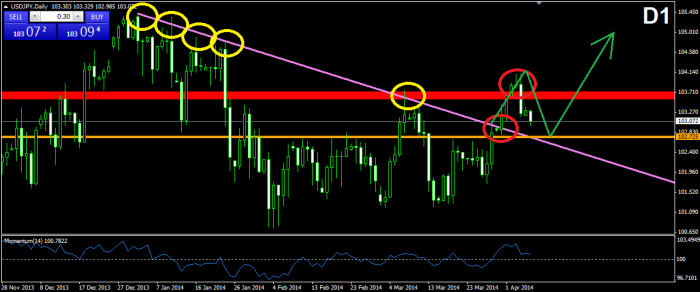
Here, on the D1 chart the price set the beginning of a classic change in the trend. After moving under the purple bearish trend line, the price did a sudden bullish break, which even broke the long-time red resistance. The price did a drop afterwards, which infers that the broken level might get tested now. In the classic change in the trend the price breaks, forms a new top, then it returns for a test of the already broken level, it bounces and then breaks the newly established level. These are four steps, from which, we already have 2 and a half. The expected scenario is shown with the green arrow on the chart.
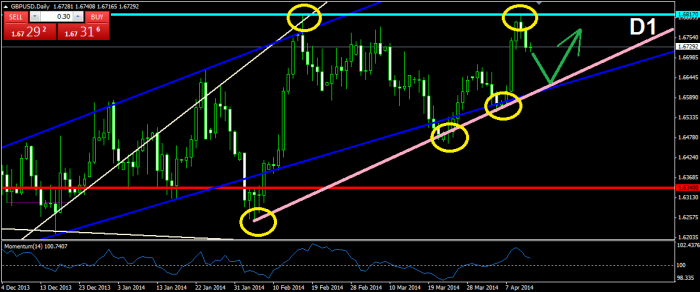
GBPUSD:
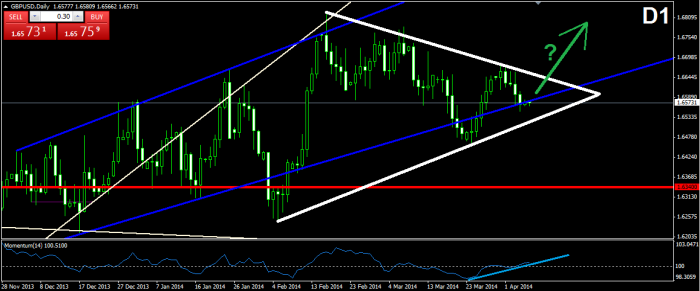
After completing the Double Top formation on the D1 chart, the price did a bearish increase, which set the lines of an ascending triangle (white) and now it looks like the formation is to its end. At the same time, the Momentum Indicator has just crossed the 100-level line in bullish direction, which brings additional confidence to the potential bullish movement. Furthermore, the price is corrently located on the lower level of the blue bullish corridor and it looks like it is slowing down. This means that the level might still has the power to support the price. For this reason the bullish movement seems to be more legit.
USDCHF:
After brealing through the orange bearish trend line, the price did a bullish increase to the 50.0% Fibonacci Level. The last two bottoms of the price could be connected with a bullish line (purple), which crosses the turquoise support in a point, which is very close to the current location of the price. For this reason, we believe that this might be the next destination of the price, which could either cross the two lines at once or it could get supported and could continue its bullish scenario. A bearish break in one of the two lines (purple and turquoise) or a break in the 100-level line of the Momentum Indicator could be counted as a trigger of a short position.
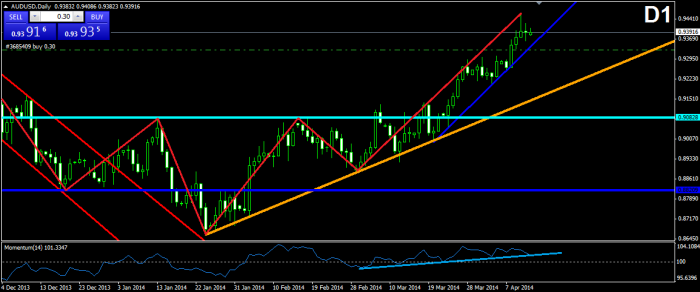
AUDUSD:
The overall potential of the price is basically bullish. After all the inverted Head and Shoulders formation on the D1 chart is still not yet completed. Currently, the price has formed a triangle (purple). The triangle is descending, which as we all know, has the potential to push the price in bearish direction. On the other hand, this could not be said for sure, because the Momentum Indicato demonstrates clear bullish activity. For this reason, we believe that the price would either break directly in bullish direction, or it will drop through the lower level of the purple triangle to the orange bullish trend line, where it will continue its bullish rise.
Technical Analysis – 03/04/2014
IMPORTANT ECONOMIC EVENTS (GMT)
EURUSD:

The price went out of the range of the three times tested white bullish trend line and at the same time, it looks like it found support in the already broken 5-years bearish trend line (turquoise). The last two bottoms of the price (the last two yellow circles), are forming something like an unconfirmed Double Bottom formation, which later might bring the price to its previous positions. Furthermore, the Momentum Indicator is about to cross the 100-level line in bullish direction, which, despite of the bearish break in the white bullish trend line, is another bullish signal. For this reason, we believe that the price might return to the purple bearish trend line for example, and to start a new bearish movement afterwards. After all, we should not forget that there is a confirmed Head and Shoulders formation on the D1 chart, which still has not demonstrated its potential.
USDJPY:

The price broke through the more than five times tested white bullish trend line and then it was stopped by the 1-year red support (thick red line). The followed bullish bounce infers that the price would most likely continue with the bullish activity and may reach new highs. The Momentum Indicator also supports this theory. The left yellow circle on the Momentum Indicator shows the bullish break through the 100-level line, which is a clear bullish signal. The right yellow circle shows the change in the bearish behavior on the Momentum Indicator and the eventual circumstance for a new bullish activity.
GBPUSD:

After the break through the 1-week bullish trend line (orange), the price created a bottom and then a second one, which creates the impression that the situation might evolve into a Double Top formation and a bullish behavior on a later stage. The good is that there are enough tops and bottoms, which allow us to draw clear support and resistance lines (blue), where the upper line – the resistance – might be counted as a Neck Line of the potential Double Bottom formation. Since the last interaction of the price was with the lower level, and the Momentum Indicator has crossed the 100-level line in bullish direction, we would probably see the price interacting with the Neck Line too. A break in some of these two levels would mean a trigger of the respectful position.
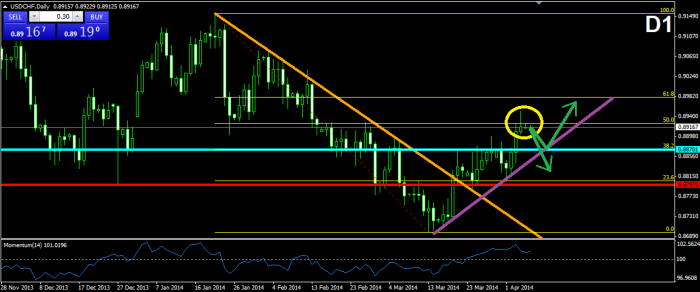
USDCHF:

The price has reached again the many times tested resistance at 0.88701 (turquoise) and it has tested it twice, where the second test has already turned into a bearish bounce. At the same time, there is a big bearish divergence between the price and the Momentum Indicator (blue lines). Furthermore, the Momentum Indicator has just did a slight bearish cross of the 100-level line, which is our third signal. For this reason, we believe that the price would conform to the turquoise resistance and would start another bearish movement, where on a later phase might turn into another bullish return.
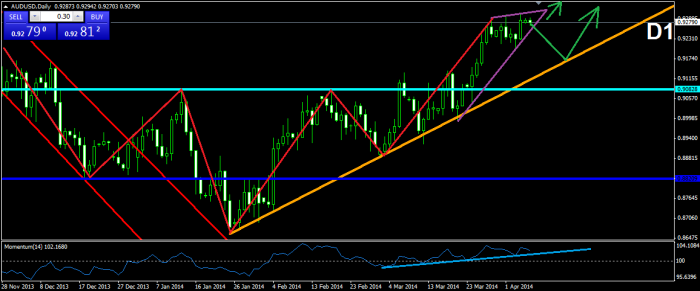
AUDUSD:

After the price broke through the purple and the blue bullish trend lines, it confirmed a Double Top formation, which, as we all know, has clear bearish potiential. At the same time, the Momentum Indicator has crossed the 100-level line in bearish direction, which confirms the bearish idea. Maybe the price would return to the orange bullish trend line, or to the turquoise support, which is the Neck Line of the inverted Head and Shoulders formation on the D1 chart. We believe that the overall bullish potential of this pear would not be violated by the current circumstances.
Technical Analysis – 01/04/2014
IMPORTANT ECONOMIC EVENTS (GMT)
EURUSD:

The overall movement of the price from the 29-months high until now is bearish and could be seen better on the H4 chart, where we have drawn the purple bearish trend line, which is visible on our graph. The price has been following this bearish trend line for the past three weeks and currently it is about to test it again as a resistance. At the same time, the Momentum Indicator is about to cross the 100-level line in bullish direction, which confirms the theory that the price might reach the purple bearish trend line. If this happens, a decrease in the price is likely to occur. After all, we should not forget the Head and Shoulders formation on the D1 chart, which, as we all know, has bearish potential.
USDJPY:

The small red bullish trend line has brought the price through the 3-months purple bearish trend line. The price is currently testing the red bullish trend line again, which means that a bullish jump is more likely to occur. Furthermore, the Momentum Indicator has formed a clearly visible descending triangle (blue lines), which as we all know, has strong bullish potential. For this reason, it would be a good idea to open a long position right after an eventual bullish bounce from the red bullish trend line, or in case of a bullish break in the descending triangle of the Momentum Indicator.
GBPUSD:

After the sudden bullish break through the three crucial levels we discussed in our previous analysis (blue, purple, orange), the price has been following the orange bullish trend line, where yesterday, it did a bullish bounce from it. Currently, the price is close to test the orange line again. The Momentum Indicator has formed a straight line from its last five bottoms, which are located under the 100-level line. As we all know, if the Momentum Indicator is located under the 100-level line, the this is an indication of a downward movement. But in this case The blue line, which connects the bottoms, could be used as a support and might be taken as a level, which pushes the price in bullish direction. For this reason, since the Momentum Indicator is on the blue support, we could take this as a bullish signal, which is the reason to believe that the price might not touch the orange bullish trend line (yellow square).
USDCHF:

After the break through the orange bearish trend line, the price is still conforming to the turquoise resistance, which is tested more than 6 times already. During the test phase of this resistance, the price has formed something like a Double Top formation, which might get confirmed at any time. Another fact to this scenario is the Momentum Indicator, which has just crossed the 100-level line in bearish direction. For this reason, we believe that the resistance turquoise resistance might appear to be stronger than the price and might push it toward a decrease, which would confirm the Double Top formation.
AUDUSD:

After breaking through the purple bullish trend line, the price found support in the 23.6% Fibonacci Level and the blue bullish trend line, which connects the candlewicks of the candles of the purple bullish trend line on H4. After bouncing in bullish direction, the price started increasing again. Furthermore, the Momentum Indicator is also in a clear bullish trend (blue line), and has just crossed the 100-level line in bullish direction. Having these facts in mind, we should not be much worried about our long positions, caused by the inverted Head and Shoulders formation on D1. 🙂
Weekly technical analysis for 31.03 – 4.04
IMPORTANT ECONOMIC EVENTS (GMT)
EURUSD:

The blue bullish trend line brought the price through the 5-years turquoise bearish trend line. Two weeks after that, the price broke through the blue bullish trend line too and it returned to the 5-yrars turquoise bearihs trend line in order to test it as a support. Doing that, the price formed the trend changing formatioj Head and Shoulders (red lines) and it even crossed its Neck Line. This means confirmation of the formation and a potential for a drop with the size of the formation itself. The Momentum Indicator is under the 100-level line and signalizes for a current bearish movement. This might be a good moment to go short with a Stop Loss line above the second shoulder of the already confirmed formation.
USDJPY:
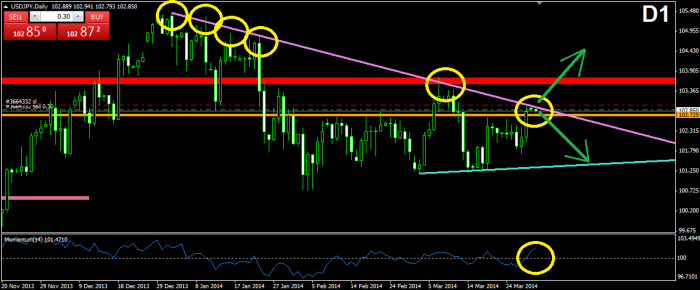
The price has increased to the 3-months purple bearish trend line in the last few days. Currently, we see a resistance of the pressure of the price for now. The interesting moment here is that the last few bottoms of the price could be connected with a line (turquoise), which closes a triangle with the purple resistance. The triangle looks like a symmetrical one, which means that the price might break in both directions. Since the price has just hit the purple bearish trend, the expected outcome is likely to be a drop to the lower level of the triangle (turquoise line). But at the same time, we have the Momentum Indicator, which supports the bullish movement for now. It might be better to wait for the indicator and the price to develop more in order to have a better idea of the situation and to go long or short.
GBPUSD:
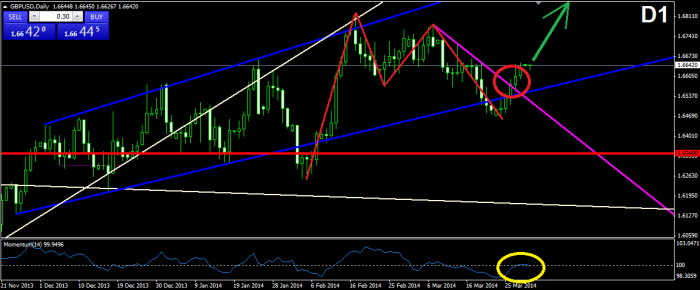
The drop of the price under the lower level of the blue bullish corridor was the last step of the price for the completion of the Double Top formation. Then, like in the previous drop, the price increased and showed signs that the new bullish movement might be here. The price crossed the purple bearish trend line, which indicates the bearish movement of the price after the Double Top formation. The Momentum Indicator is slightly above the 100-level line, which is another sign that the bulls might appear the stronger ones. For this reason, going long might be a good idea, which could turn into a profit with the size of the previous increase after the last drop under the lower level of the blue bullish corridor.
USDCHF:
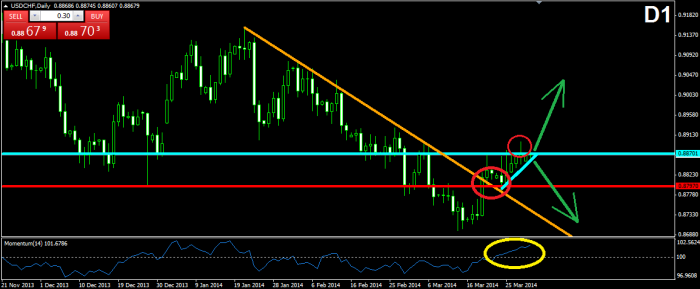
After moving under the bearish trend line (orange) for the last two months, the price did a bullish increase, which broke the orange trend line. A resistance, which indicates some of the previous bottoms and tops of the price was also broken at the same time when the trend line was broken. Then a consolidation appeared. The consolidation has the shape of a ascending triangle, which in most of the cases breaks in bearish direction. This time, the price did a clear bullish break through the upper level of the triangle, which means that this case might be an exception. The Momentum Indicator shows clear support for the bulls too. Anyway, we might want to wait for a while, in order to see if the price is really going to increase, or it will suddenly change its direction to bearish.
AUDUSD:
The price has started the expected bullish movement as a result of the inverted Head and Shoulders formation, which was confirmed about two weeks ago. The increase began and the price completed something like 1/3 of its potential. Now the price is correcting and we are probably going to see another bullish increase for another part of the expected bullish profit. The Momentum Indicator shows support for the bulls, but it could also do a correction in order to gain some more space for increase. For this reason, the best move here might appear to be the opening of a long position, right after the price does a clear bullish jump, which could easily be distinguished from its other candles.
